FIG. 1.
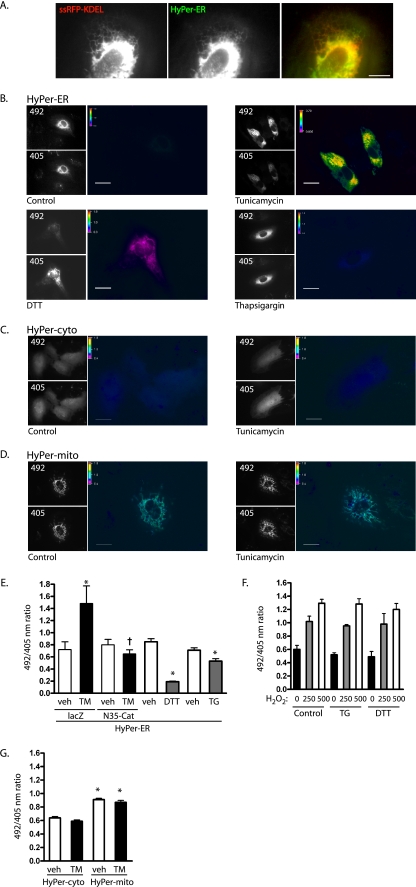
Tunicamycin increases ER H2O2. (A) Cotransfection of HyPer-ER (green channel) and ssRFP-KDEL (red channel) shows colocalization. The image was acquired with TIRF optics. Scale bar, 10 μm. (B) HUVEC transfected with HyPer-ER were treated with vehicle (0.001% dimethyl sulfoxide [DMSO]), tunicamycin (10 μg/ml), DTT (2 mM), or thapsigargin (0.4 μM) for 16 h and sequentially excited at 492 and 405 nm. The grayscale images show the relative intensities of representative fields; 492/405 ratios are shown as pseudocolored images. Scale bars, 20 μm. (C and D) HUVEC transfected with untargeted HyPer-cyto (C) or mitochondrially targeted HyPer-mito (D) were treated with vehicle or tunicamycin for 16 h and ratio imaged. Scale bars, 20 μm. (E) 492/405 ratios were quantified for cells treated with corresponding vehicle (veh), tunicamycin (TM), DTT, or thapsigargin (TG). The indicated cells were exposed to adenovirus harboring lacZ (control) or ER-targeted catalase (N35-Cat). Means and standard errors of the mean (SEM) for 8 to 18 individual determinations are shown. *, P < 0.05 from vehicle. Expression of N35-Cat decreased the ratio of TM-treated cells (†, P < 0.01 from TM-plus-lacZ control). (F) HUVEC were transfected with HyPer-ER and exposed to thapsigargin or DTT for 16 h. The reagent H2O2 was added in the indicated concentrations, and 492/405 ratio images were taken after 3 to 5 min. (G) 492/405 ratios were quantified for cells transfected with either HyPer-cyto or HyPer-mito and treated with vehicle or tunicamycin for 16 h. Means and SEM of 12 to 15 individual determinations are shown. *, P < 0.001 from HyPer-cyto/vehicle.

