FIG. 1.

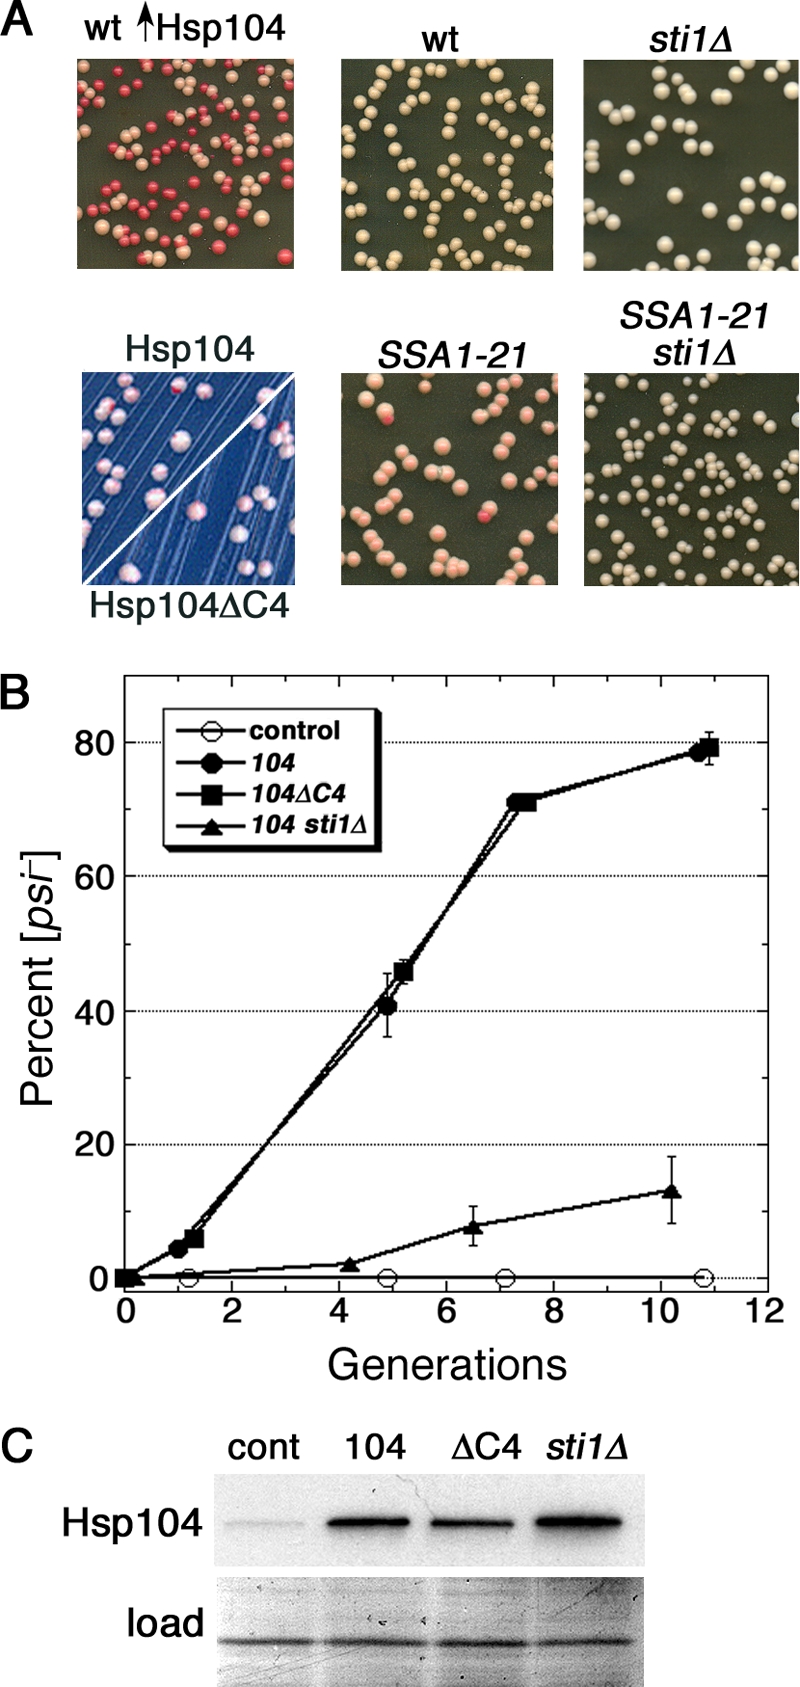
Sti1 mediates Ssa1-21 inhibition of [PSI+] and is critical for curing of [PSI+] by Hsp104 overexpression. (A) The upper left panel shows wild-type (wt) cells that overexpressed Hsp104 for ∼5 generations and then were spread onto 1/2YPD plates and grown for 2 to 3 days at 30°C. White colonies are [PSI+], and red colonies arose from cells that lost [PSI+]. The lower left panel shows hsp104Δ cells expressing Hsp104 or Hsp104ΔC4 (as indicated) from a plasmid, which produces roughly 3-fold more Hsp104 than chromosomally expressed Hsp104, grown similarly but on defined medium with limiting (8 mg/liter) adenine. Instability of [PSI+] caused by the modestly elevated Hsp104 is detectable as red sectoring in otherwise white colonies. Overall color and sectoring frequency of cells expressing the different Hsp104 proteins are indistinguishable. Wild-type and SSA1-21 mutant cells (center panels) or the same combined with deletion of STI1 (sti1Δ; right panels) were spread onto 1/2YPD and incubated as described above to illustrate [PSI+] phenotypes. All panels are representative 2.5-cm squares from plates, except those on the lower left, which are magnified ×2 relative to others. Images were made by scanning plates by the use of an HP ScanJet 6300C document scanner. Color and contrast of the assembly of images were optimized using Adobe Photoshop 7.0 software. (B) Appearance of [psi−] cells in growing cultures is shown as a function of generations (monitored as doubling of OD600). All cultures were grown in medium containing 100 μM CuSO4 to induce expression from the CUP1 promoter and then spread onto 1/2YPD plates and incubated as described above. Wild-type cells carried plasmids without HSP104 (control), with wild-type HSP104 (104), or with HSP104ΔC4 (104ΔC4). The sti1Δ cells over-express wild-type HSP104. To maintain continuous growth, cultures were diluted into fresh medium when the OD600 reached 1 to 2. No [psi−] colonies appeared among over 900 colonies from the control cultures at any of the time points. Values are averages of the results for three independent experiments ± standard error of the mean (SEM). (C) Western analysis of the abundance of Hsp104 and Hsp104ΔC4 in cells used for the experiment in panel B from cultures grown for roughly 10 generations. Bottom panel (load) shows a portion of the membrane used for the blot stained by amido black as a loading and transfer control.
