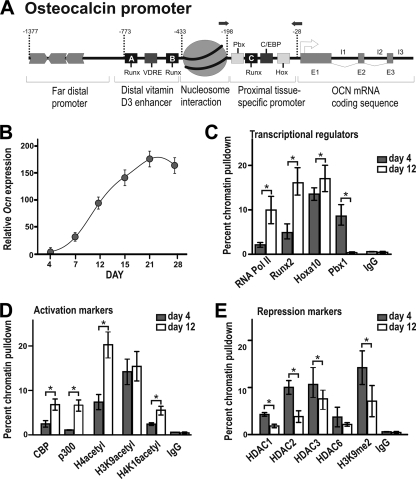
FIG. 6.
Pbx1 displays a pattern of gene-repressive functionality on the osteocalcin promoter. (A) Diagram of rat osteocalcin promoter displaying relative binding sites and primer sites used for chromatin immunoprecipitation analysis. Rat calvarial osteoblasts were isolated from embryonic day 18.5 rat pups and collected during the proliferative stage (day 4) or cultured in differentiating conditions and collected during exponential increase in osteocalcin expression (day 12). (B) Calvarial osteoblasts were analyzed at the indicated differentiation stages by RT-qPCR to determine levels of osteocalcin gene expression. (C to E) The ChIP analysis was performed on cleared lysates from primary osteoblasts using ∼5 μg of the indicated antibody. Recovered DNA was then quantified by qPCR using primers specific for the proximal promoter region of the osteocalcin gene to determine relative occupancy of transcriptional activators (C), activation markers (D), or repressive markers (E). Statistical significance was determined by Student's t test (*, P < 0.05 versus matched control). ChIP experiments were repeated at least two times with similar results, and one representative experiment is presented (± standard deviation [SD]).

