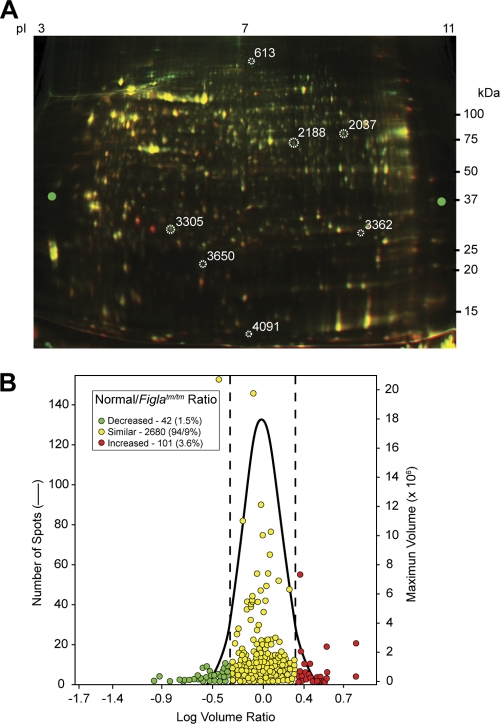
FIG. 1.
2D-DIGE of proteins in normal and Figla null newborn mouse ovaries. (A) Ovarian protein extracts of normal (green) and Figla null (red) mice were labeled with Cy5 and Cy3, respectively, and separated by 2D-DIGE. Molecular masses (in kDa) are shown on the right, and the pI gradient was estimated from the label on the isoelectric focusing gel. (B) Comparison of log volume ratios of proteins expressed in normal and Figla null ovaries. While most (2,680) proteins were similar (94.9% [yellow]), 101 protein spots were increased in normal ovaries (3.6% [red]) and 42 (1.5% [green]) were increased in Figla null ovaries.

