FIG. 6.
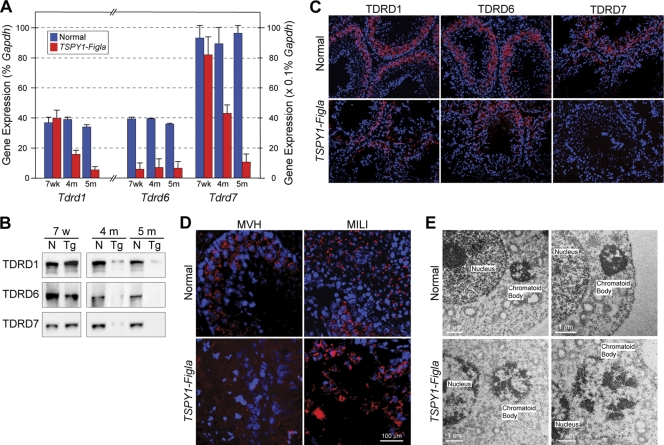
Tdrd expression and chromatoid body formation. (A) Expression levels of Tdrd1, Tdrd6, and Tdrd7 were determined as a percentage of Gapdh expression by qRT-PCR (mean ± SEM) in mixed germ cells isolated from normal and TSPY1-Figla transgenic mouse testes at 7 weeks, 4 months, and 5 months. (B) Immunoblot of extracts of mixed germ cells from normal and TSPY1-Figla transgenic mice at 7 weeks, 4 months, and 5 months that were probed with antibodies to TDRD1, TDRD6, and TDRD7. (C) Immunofluorescence of 4-month-old normal and TSPY1-Figla transgenic mouse testes probed with antibodies to TDRD1, TDRD6, and TDRD7 (red). Nuclei were stained with Hoechst 33242 (blue). (D) Immunofluorescence of normal and TSPY1-Figla testes with antibodies to MVH (red) or MILI (red) as markers of the chromatoid body. Nuclei were stained with Hoechst 33242 (blue). (E) Electron microscopy of normal and TSPY1-Figla testes (two biological samples), demonstrating that the normally compact electron-dense chromatoid body in close proximity to the nucleus becomes less dense and more diffuse in transgenic sperm.

