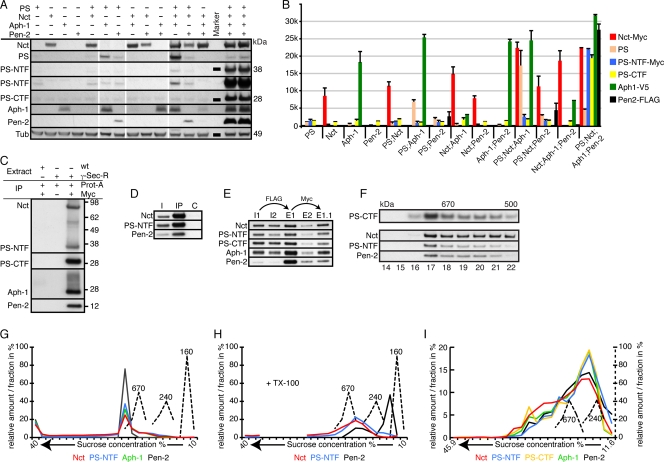
FIG. 1.
Molecular characteristics of in vivo-reconstituted γ-secretase. If not otherwise indicated, homogenates from adult fly heads expressing GAL4 under the control of GMR were used in this and all following figures. (A) Protein immunoblot analyses of fly heads expressing the indicated γ-secretase components. For PS-NTF, two different exposure times are shown, with the longer exposure beneath the shorter exposure. Tubulin (Tub) served as the loading control for these samples. (B) Histogram showing the quantification (plus standard deviations [SD]) of the normalized amounts of the different γ-secretase-R components detected in panel A. PS-CTF was present in all genotypes, as the antibody used recognized endogenous, as well as transgenically expressed, PS-CTF. (C) Co-IP of γ-secretase-R (γ-sec-R) components with protein A-Sepharose (Prot-A) and anti-Myc antibodies, which recognize the Myc epitope tags on transgenically expressed PS and Nct. wt, wild type. (D) Co-IP of γ-secretase-R components with an antibody raised against a peptide epitope of Aph-1. I, input; C, control (nonfunctional anti-Aph-1 antibody). (E) Co-IP and tandem purification of γ-secretase-R components. In the first step, the complex was enriched using anti-FLAG antibodies that recognize transgenically expressed Pen-2 and eluted with FLAG-peptide (E1 and E2). The eluted complex was then further purified with anti-Myc antibodies that recognize transgenically expressed PS and Nct and eluted using Myc peptide (E1.1). I1 and E1, input and eluate from detergent-extracted total fly heads; I2 and E2, input and eluate from detergent-extracted membrane preparations. (F) Protein immunoblot analyses of fractions from size exclusion chromatography. On top, the elution profile for γ-secretase-E is shown (PS-CTF). Below is the profile for γ-secretase-R, probed with antibodies to the three individual components shown on the left. (G and H) Diagrams of the distribution profiles of γ-secretase-R in continuous sucrose gradients with or without Triton X-100 (TX-100). The molecular masses of marker proteins are displayed in kDa. The distribution profile of each component is color coded to match the corresponding component shown at the bottom. (I) Diagram of the distribution profile of γ-secretase-R in a continuous sucrose gradient containing the detergent CHAPSO, with unit scales and color coding as in panel F. Antibodies used: anti-Myc recognizing transgenic Nct and PS-NTF, anti-V5 recognizing transgenic Aph-1, anti-FLAG recognizing transgenic Pen-2, and anti-PS-loop recognizing endogenous and transgenic PS and PS-CTF.

