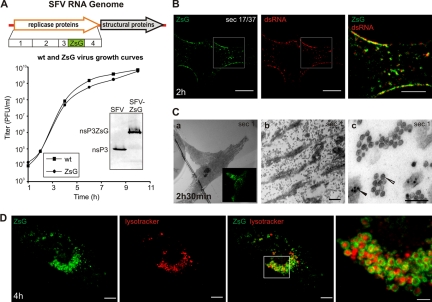
FIG. 3.
Analysis of replication of SFV-ZsG in fixed and live cells. (A) (Top) Schematic view of the SFV-ZsG genome. The insertion of the ZsG sequence is highlighted. (Bottom) The growth curve of SFV-ZsG is compared to that of the wt SFV4 virus. BHK cells were infected with 10 PFU/cell, and aliquots were taken every 2 h. Titers (PFU/ml) were determined by a plaque assay. At 10 h, cells were lysed, and samples were analyzed by Western blotting with anti-nsP3 antibodies to verify the presence of the fusion protein nsP3-ZsG (shown in the inset). (B) PM localization of RCs containing ZsG early in infection. BHK cells were infected with SFV-ZsG at 500 PFU/cell and were fixed at 2 h p.i. An anti-dsRNA antibody (red) was used to confirm the presence of ZsG in replication complexes. A representative confocal section is shown. The area that is boxed in the left and center panels is displayed at higher magnification on the right and shows the colocalization of the dsRNA and ZsG signals. Bars, 10 μm (left and center) and 5 μm (right). (C) Correlative light-electron microscopy (CLEM) was used to study the RCs at the bottom of the cell. BHK cells were infected with SFV-ZsG VRPs (MOI, 500), and at 2 h 30 min p.i., cells were fixed with glutaraldehyde. (a) A representative infected cell was imaged with a confocal microscope (inset image in green). The same cell was relocated by EM, and the first horizontal section (sec 1) was analyzed. (b) A higher magnification of the same cell shows massive amounts of spherules at the bottom of the cell. Bar, 1 μm. (c) Higher magnification of panel b, showing clusters of spherules (white arrowhead) distinct from the nucleocapsids (black arrowhead). Bar, 200 nm. (D) Live-cell imaging of BHK cells infected with SFV-ZsG VRPs (MOI, 500). The cellular acidic compartment was visualized by LysoTracker (red). Images were captured at 4 h p.i. with confocal microscopy. 3D reconstruction of the entire cell is shown (see Materials and Methods). Bars, 10 μm (left and central panels) and 3 μm (rightmost panel).

