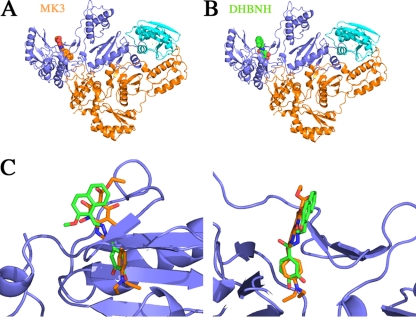
FIG. 6.
Comparison of the binding of MK3 and DHBNH away from the RNase H active site. (A) The structure of full-length RT is shown as a ribbon diagram (p66 subunit in blue and p51 subunit in orange) bound to MK3 (orange) on the left and DHBNH (green) on the right(16). (B) The two inhibitors are overlaid with MK3 in orange and DHBNH in green, showing a common binding site for both inhibitors. A rotated perspective of the binding site is shown on the right.

