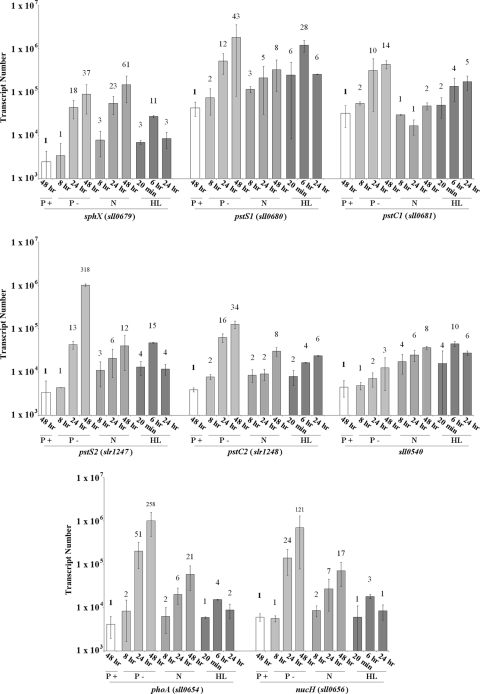
FIG. 4.
Expression profiles of the Synechocystis pho regulon genes under Pi-replete (P+), Pi stress (P-), and N stress (N) conditions as well as following a shift to high light intensity (HL). Bar height indicates absolute transcript abundance per ng cDNA used in each qPCR. Numbers above each bar indicate fold change in gene expression compared to the gene transcript abundance at 48 h under Pi-replete conditions (indicated in bold).

