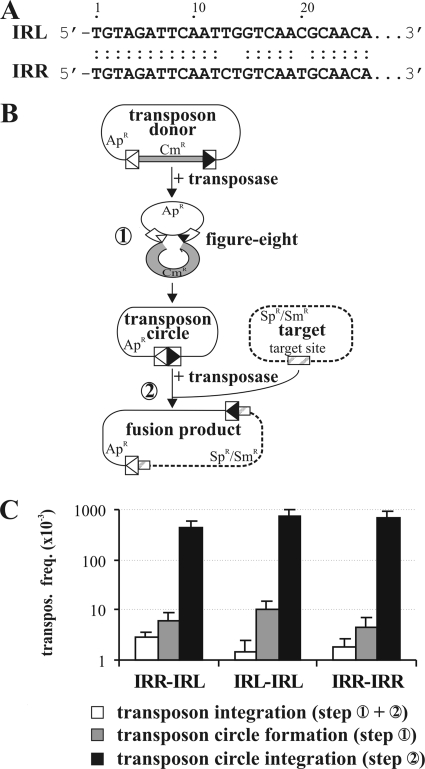
FIG. 1.
Transposition assays for comparing the IS30-based transposons composed of simple IRs. (A) Comparison of the IS30 IR sequences. Dots indicate matching bases. (B) Schematic representation of the intermolecular transposition pathway. The graph shows the two major steps characteristic for IS30 transposition (steps 1 and 2). The transposon donor plasmid and its derivative, the circular transposon (thin line), carry the 26-bp IRs of IS30 (boxes with open and filled triangles representing IRL and IRR, respectively). The Cmr gene flanking the transposon in the donor plasmid is shown as a gray box. The target plasmid (dotted line) carries the GOHS hot spot sequence (cross-hatched box). (C) Transposition frequencies of IS30-based transposons with different combinations of the IRs. The graph shows the overall frequency of transposition into the hot spot (steps 1 and 2) and the frequency of the major steps assayed separately. Data were obtained from at least three parallel experiments.

