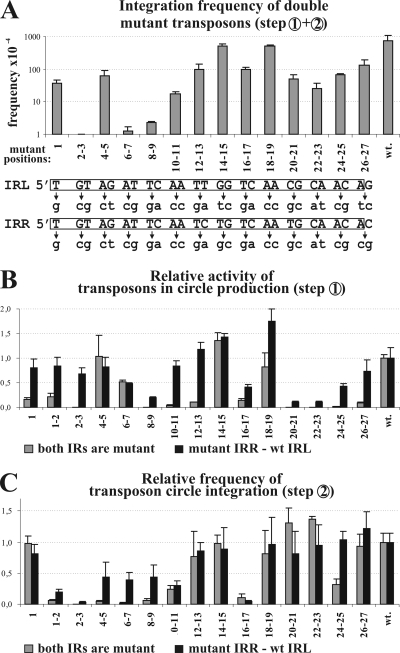
FIG. 2.
Activities of transposons harboring the same mutations in one or both ends. (A) Integration frequency of double mutant transposons. The graph represents the mean value of at least five parallel experiments measuring the overall frequency of transposon integration (steps 1 and 2; Fig. 1B) into the target. Base changes in the transposon ends are shown below the graph; the numbering refers to the mutant positions. The wt IRs are boxed. (B) Effects of IR mutations on the transposon circularization (step 1; Fig. 1B). The activity was characterized by the relative intensity of the junction fragments (see supplemental material). The graph shows the mean values of three parallel experiments for each mutant transposon donor normalized to that of the wild type (wt = 1). Note that less than 4% of the wt activity results in undetectable fragment intensity on the gel. (C) Effects of IR mutations on the integration of transposon circles (step 2; Fig. 1B). The assay measures the efficiency of integration into the target site. Frequency data are normalized to that of the wt transposon circle (wt = 1) and represent the mean values of five parallel measurements.

