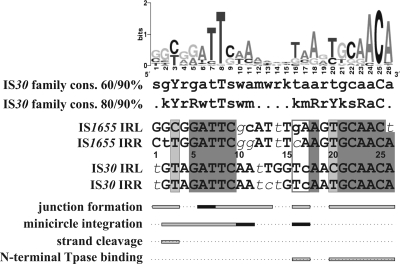
FIG. 8.
Schematic representation of the functional regions of IS30 IRs and their comparison to the family consensus and the sequence of the closely related family member IS1655. The sequence logo and the two consensus (cons.) sequences were generated for 53 IS30 family members collected from public databases (IS Finder and GenBank; the whole collection will be published elsewhere). Uppercase letters, >90% conservation; lowercase letters, >60% and >80% conservation in the two consensus sequences, respectively (r = A or G, y = C or T, m = A or C, k = G or T, s = C or G, w = A or T). Within the IR sequences, uppercase letters show bases matching both the consensus and the sequence logo, lowercase letters show bases differing from the same bases in the logo but matching the 80/90% consensus sequences, and lowercase italic letters indicate bases differing from the corresponding bases of both the consensus and the sequence logo. Dark gray shading, perfect matches in the four IRs (note that the IRs of IS1655 are only 25 bp long); light gray, divergent positions still matching the 90% consensus; open box in IR sequences, bases where the base change in the IS1655 IRs to the corresponding bases of IS30 IRs led to the correct integration of the IS1655 circle by the IS30 Tpase; horizontal bars below IR sequences, those positions where the IS30 IR mutations significantly affected the given functions; dark bars, positions where the single and double mutants had similar activities (Fig. 2 and Table 1).

