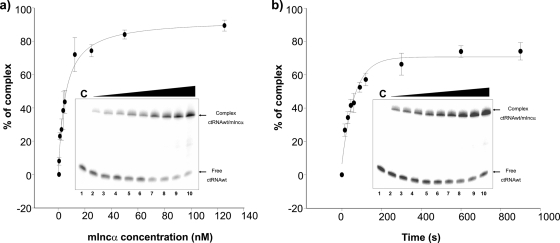
FIG. 2.
ctRNA binding kinetics. Binding assays were performed as described in Material and Methods. (a) A graphic representation of the relative complex formation between the ctRNA and mIncα as s function of the mIncα concentration. (b) A graphic representation of the relative complex formation between the ctRNA and mIncα as a function of the time of incubation.

