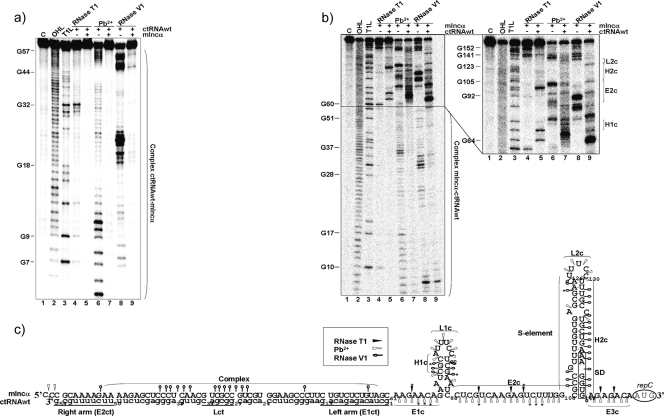
FIG. 5.
ctRNA/mIncα complex secondary structure. (a) Autoradiogram of a polyacrylamide gel of 5′-labeled ctRNA in the presence or absence of the target RNA (mIncα) treated with RNase T1, lead acetate (Pb2+), and RNase V1. Lane 1 (C), undigested probe; lane 2 (OHL), alkaline ladder; lane 3, (T1L), RNase T1 partial digestion of denatured ctRNA used as a ladder; lane 4, RNase T1 partial digestion of ctRNA; lane 5, RNase T1 partial digestion of ctRNA in the presence of a 10× excess of target mIncα; lane 6, Pb2+ partial degradation of ctRNA; lane 7, Pb2+ partial degradation of ctRNA in the presence of a 10× excess of target mIncα; lane 8, RNase V1 partial digestion of ctRNA; lane 9, RNase V1 partial digestion of ctRNA in the presence of a 10× excess of target mIncα. (b) Autoradiograms of polyacrylamide gels of 5′-labeled mIncα in the presence or absence of the target ctRNA treated with RNase T1, Pb2+, and RNase V1. Lane 1 (C), undigested probe; lane 2 (OHL), alkaline ladder; lane 3, (T1L), RNase T1 partial digestion of denatured mIncα used as a ladder; lane 4, RNase T1 partial digestion of mIncα; lane 5, RNase T1 partial digestion of mIncα in the presence of a 10× excess of target ctRNA; lane 6, Pb2+ partial degradation of mIncα; lane 7, Pb2+ partial degradation of mIncα in the presence of a 10× excess of target ctRNA; lane 8, RNase V1 partial digestion of mIncα; lane 9, RNase V1 partial digestion of mIncα in the presence of a 10× excess of target ctRNA. (c) ctRNA/mIncα complex secondary structure model consistent with cleavage patterns. Uppercase letters indicate sequence corresponding to mIncα, and lowercase letters indicate the ctRNA sequence. Black arrowheads indicate RNase T1 sites, white arrowheads indicate the Pb2+ sites, and open circles indicate RNase V1 cleavage. Relevant loops, helixes, and linear regions are marked with letters L, H, and E, followed by a number and a second letter, c. “SD” indicates the position of repC Shine-Dalgarno sequence. Major cuts are indicated by asterisks (*).

