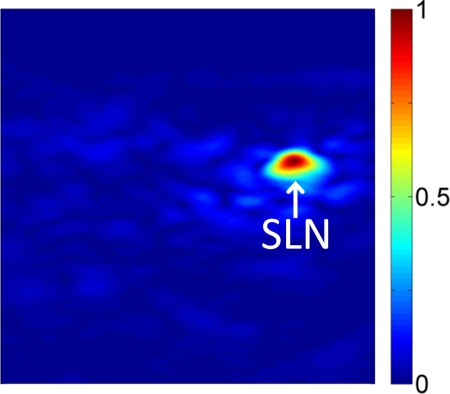
Figure 2b:
Noninvasive photoacoustic B-mode images of SLNs show results from each probe from a different rat acquired in vivo with (a–c) S5-1 probe, (d–f) L8-4 probe, and (g–i) L15-7io probe. (a, d, g) Control photoacoustic images acquired before methylene blue injection. (b, e, h) Photoacoustic images acquired 20 minutes following methylene blue injection. (c, f, i) Coregistered photoacoustic and US images acquired 20 minutes following methylene blue injection. X = x-axis, Z = z-axis.

