Figure 4b:
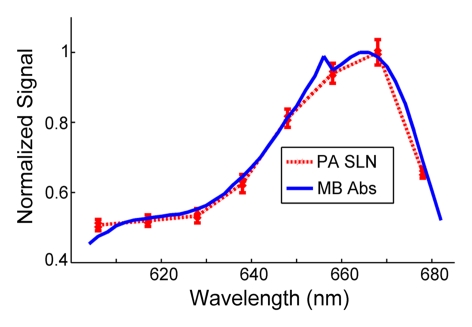
Coregistered photoacoustic and US B-mode images of rat SLNs acquired in vivo with added biologic tissue for increased imaging depth. (a) SLN image acquired with S5-1 probe through additional 2-cm turkey breast 22 minutes following methylene blue injection. X = x-axis, Z = z-axis. (b) Graph shows confirmation of methylene blue accumulation in SLNs by using spectroscopic photoacoustic imaging. Error bars = standard deviation from 30 photoacoustic images collected at each optical wavelength, MB Abs = methylene blue absorption, PA = photoacoustic.

