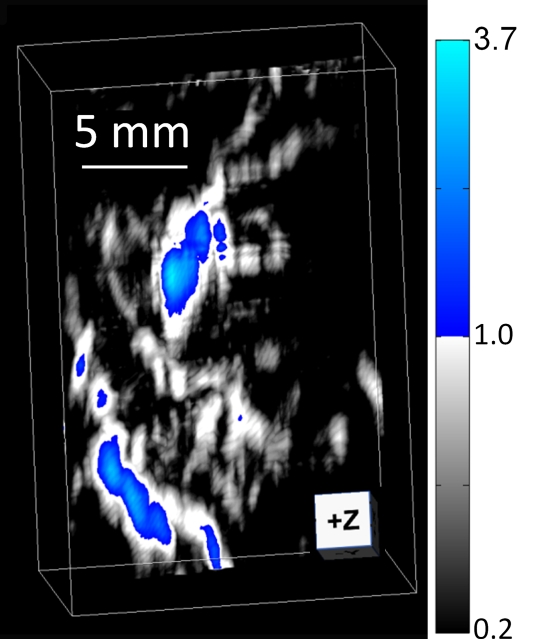
Figure 5e:
In vivo photoacoustic MAP images of rat axillary region. (a) Control photoacoustic MAP image collected prior to methylene blue injection. BV = blood vessel, X = x-axis, Y = y-axis. (b, c, d) Photoacoustic MAP images collected 6, 20, and 31 minutes following methylene blue injection, respectively. Blue color map is used to display signal intensities above the maximum amplitude from the preinjection image. Color bar pertains to images a–d. LV = lymph vessel. (e) Volumetric photoacoustic image of rat axilla 20 minutes following methylene blue injection. Z = z-axis. (f) Graph shows dynamic changes in photoacoustic signal amplitudes from SLN, lymph vessel, and blood vessel. Following methylene blue injection, signal intensities from SLN and lymph vessel increase strongly, and over time, the SLN signal continues to increase while lymph vessel signal decreases as methylene blue travels from the lymph vessel and accumulates in the lymph node. No substantial changes were observed in blood vessel signal amplitudes. Error bars = standard deviation from multiple pixels in each region of interest.

