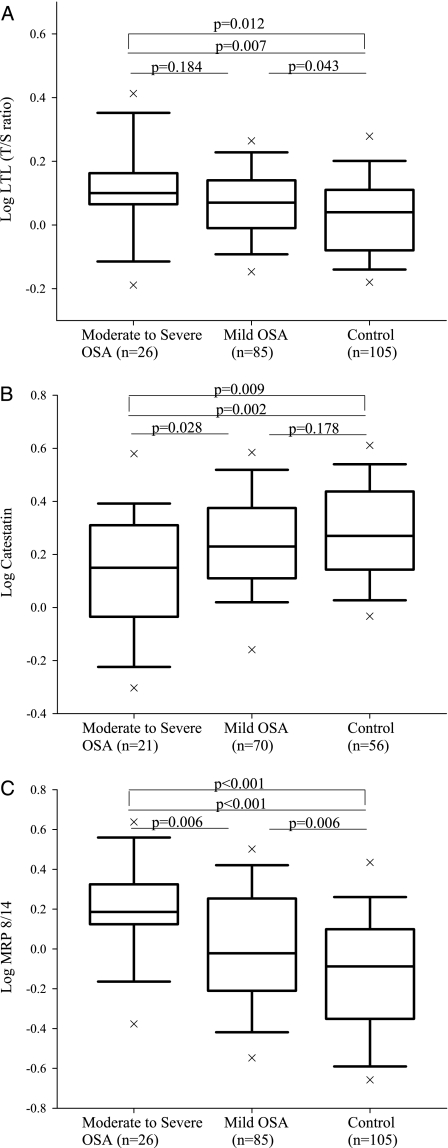
Figure 1.
Boxplots of LTL in 102 controls and 111 subjects with OSA (A). Boxplots of catestatin levels in 56 controls and 91 subjects with OSA (B). Boxplots of MRP 8/14 levels in 102 controls and 111 subjects with OSA. LTL = leukocyte telomere length; MRP = myeloid-related protein; T/S ratio = amount of telomeric DNA to amount of single-copy control gene DNA.

