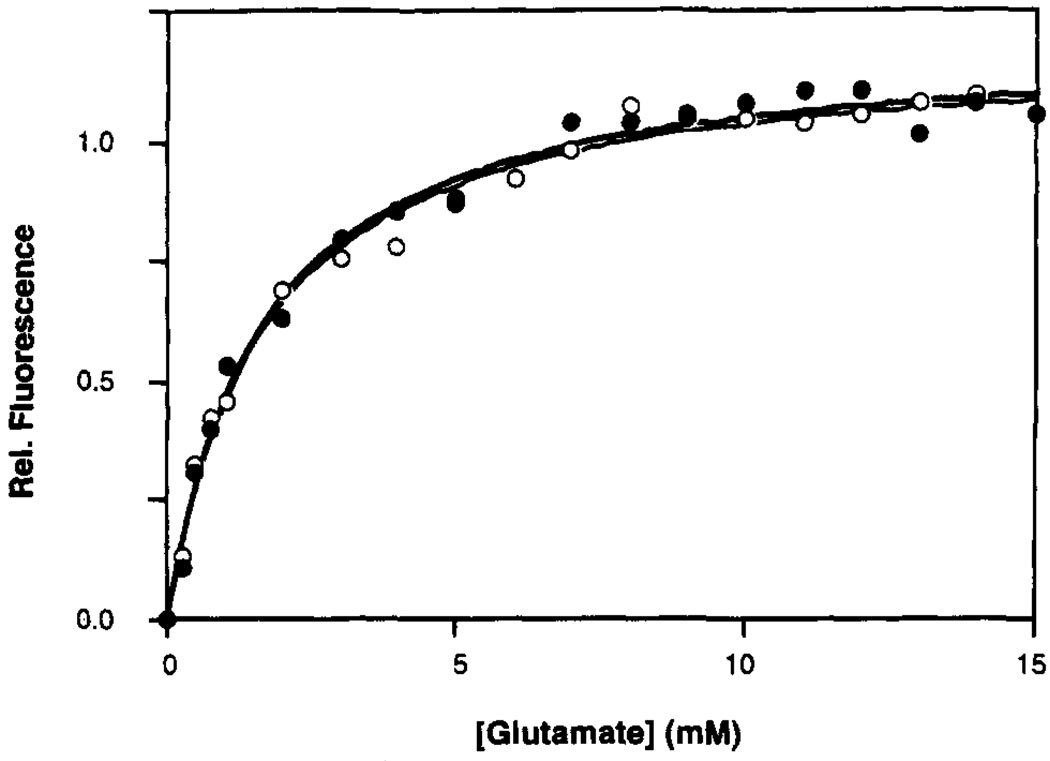
FIGURE 2.
Glutamate binding curves at 25 °C for the oxidized N36C (closed circles) and N36C/F107Y (open circles) ligand binding domains, obtained by monitoring intrinsic tryptophan fluorescence. A nonlinear least squares best-fit curve generated for a homogeneous population of sites is shown for each domain (N36C = bold line; N36C/F107Y = narrow line; best fit KD values summarized in Table 2). The buffer was 10 mM Tris, pH 8.0 with HCl, 50 mM NaCl, 50 mM KCl, and 1 mM MgCl2 The concentration of the dimeric domain was 2.5 µM (or 5.0 µM monomer).

