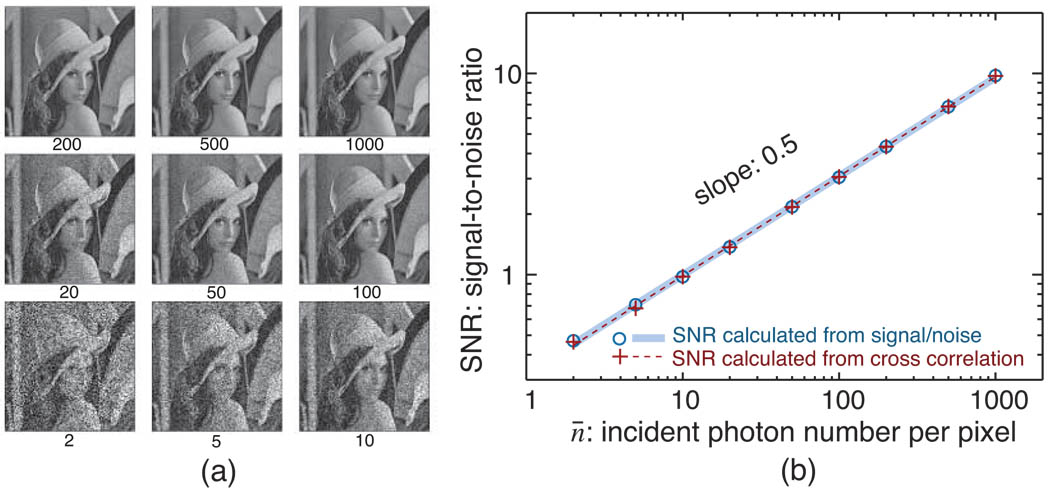
Fig. 1.
(a) Images with noise simulated according to different mean photon numbers per pixel n¯. Without noise, each pixel p has a value Ip of between 0 and 1. With illumination of n¯ photons per pixel, each pixel has a starting value of n̄Ip photons which was used on a pixel-by-pixel basis to generate an image using signal-dependent noise calculated using the positive-integer-truncated Gaussian approximation. (b) signal-to-noise ratio (SNR) calculated from the images versus incident photon number per pixel n¯. The signal-to-noise ratio was calculated both by comparison of the noisy image with the noise-free original image described in Eqs. (7) and (8), and by using the two-noisy-image correlation method described in Eqs. (11) and (14). Since a fit of the data on a log-log plot of SNR versus n¯ shows a slope of 0.5 as expected from Eq. (5), both image SNR methods give the expected scaling of SNR versus exposure n¯.

