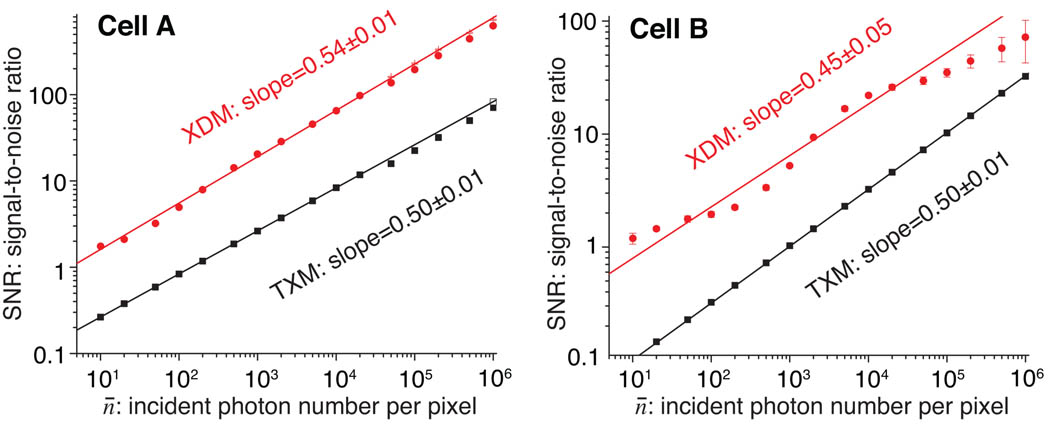
Fig. 6.
Plots of the signal-to-noise ratio SNR as a function of incident photons per pixel n¯ for our simulation set. The results at left are for the defined object “cell A”, while those at right are for “cell B” (see Fig. 2). The results for both x-ray diffraction microscopy (XDM) and transmission x-ray microscopy (TXM) are shown. In each case a slope of about 1/2 is observed in the log10(SNR) versus log10(n¯) plot (Eq. (5)), and for both objects the SNR for x-ray diffraction microscopy is about 7 times higher than it is for transmission x-ray microscopy. For x-ray diffraction microscopy of cell B, the SNR curve oscillates around the straight line fit. This oscillation corresponds to providing enough signal to phase data in successive Airy rings in the diffraction pattern of the overall spherical shape of cell B, as shown in Fig. 3.

