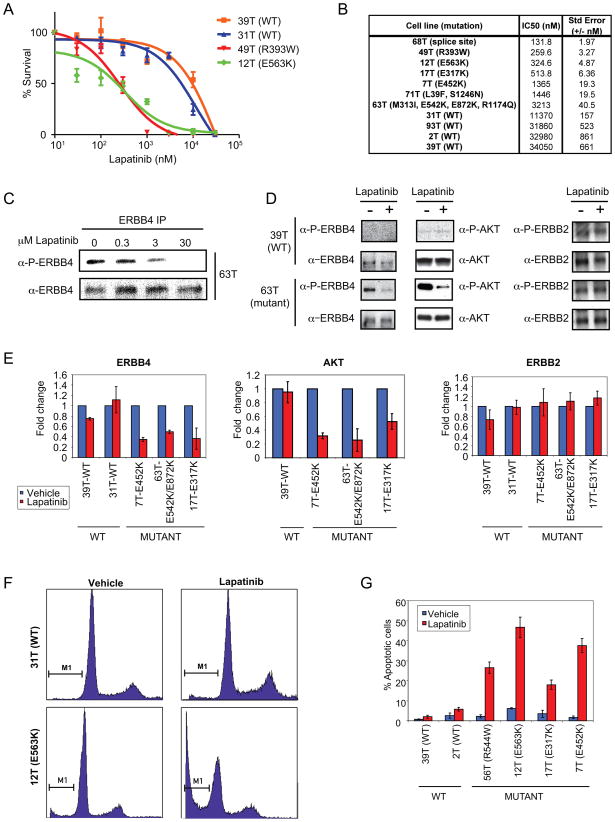
Figure 5. Melanoma lines expressing ERBB4 mutants exhibit increased sensitivity to ERBB inhibition by lapatinib.
A. Representative dose response curves showing lapatinib efficacy against ERBB4 mutant lines compared to WT ERBB4 lines. Cells were treated for 72 hours in the presence of increasing concentrations (0.01–30 μM) of lapatinib, and relative cell number was estimated by methylene blue protein staining and plotted as percent survival when compared to vehicle-treated control versus Log (lapatinib) nM (where 1 is 10 nM lapatinib). Fitted lines were generated using 4-parameter nonlinear regression via GraphPad Prism. B. ERBB4 mutant lines have increased sensitivity to lapatinib compared to WT ERBB4 lines. The IC50 values for inhibition of cell growth by 72 hr treatment with lapatinib of a larger panel of lines harboring WT and mutant ERBB4 were analyzed using GraphPad Prism v.5 (n=3). C. Immunoprecipitation and western blot analysis of ERBB4 autophosphorylation in cells treated with lapatinib. Cells were treated for 1 hr with lapatinib or vehicle alone as control. Lysates were immunoprecipitated with α-ERBB4 followed by western blot analysis with α-ERBB4 and α-P-ERBB4 (Y1162). D. Melanoma lines expressing mutant ERBB4 exhibit increased lapatinib sensitivity with respect to ERBB4 as well as AKT phosphorylation. The activity of ERBB4, AKT as well as ERBB2 was determined by immunoblotting with phospho-specific antibodies. Cells were treated for 1 hr with 5 μM lapatinib or vehicle alone. Lysates were immunoprecipitated using α-ERBB2 or α-ERBB4. Lysates and immunoprecipitates were analyzed by western blotting using the indicated antibodies. Shown are representative blots. E. Quantitative assessment of data from 2 lines harboring WT ERBB4 and 3 lines harboring mutant ERBB4 that were performed similarly to D. D. The ratio of band intensities of (P-Y1162)-ERBB4/ERBB4, (P)-S473-AKT/AKT and (P-Y1248)-ERBB2/ERBB2 for each cell line are shown. F. Mutant ERBB4 cells have increased sub-G1 population in the presence of lapatinib compared to WT ERBB4 cells. FACS analysis of 31T (WT) and 12T (E563K) showing cell cycle distribution (PI staining, x-axis) vs cell counts (y-axis). Shown are representative plots. G. Quantitation of FACS-sorted lapatinib-treated cells. The percent apoptotic cells were determined based on the sub G1 population for vehicle treated cells or lapatinib treated cells.

