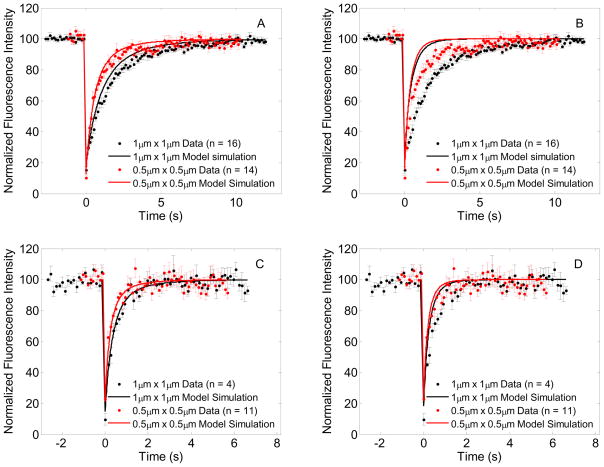
Figure 5.
FRAP data with model simulations for lateral membrane diffusion and exchange with cytosol. In each panel, the FRAP data for 1μm × 1μm and 0.5μm × 0.5μm bleach ROI’s are plotted using black and red dots, and the corresponding model simulations are plotted using black and red solid lines respectively. (A) GFP-Ras2 data with model predictions for diffusion and slow exchange with parameters D = 0.0691 μm2/s; α = 27.7 s−1; kon = 0.01 dm s−1; koff = 0.1 s−1, (B) GFP-Ras2 data with model predictions for diffusion and fast exchange with parameters D = 0.0691 μm2/s; α = 27.7 s−1; kon = 0.1 dm s−1; koff = 1 s−1, (C) GFP-Ras2C318S data with model predictions for diffusion and slow exchange with parameters D = 0.2743 μm2/s; α = 43.09 s−1; kon = 0.01 dm s−1; koff = 0.1 s−1, (D) GFP-Ras2C318S data with model predictions for diffusion and fast exchange with parameters D = 0.2768 μm2/s; α = 43.5 s−1; kon = 0.1 dm s−1; koff = 1 s−1

