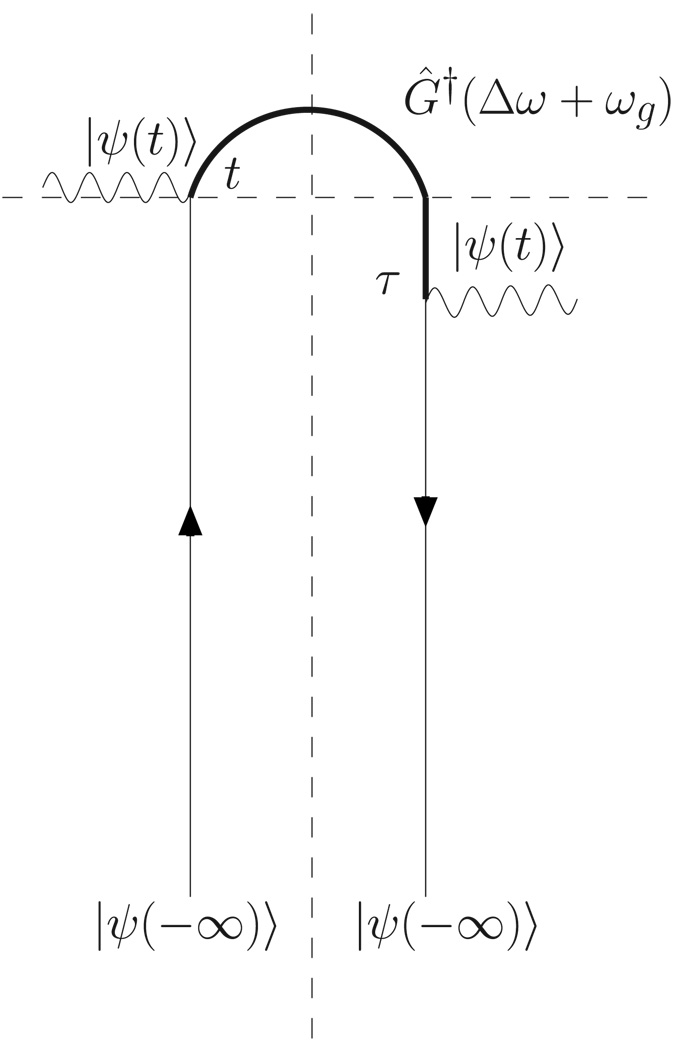
FIG. 6.
By dissecting the loop along its center line it factorizes into two single-sided Feynman diagrams. This is possible since the system remains in the same state |ψ(t)〉 between the topmost interaction on the two branches which occur, respectively, at times t and τ. The advanced propagator G†(Δω + ωg), representing backward propagation from t to τ, joins the two.

