
Figure 5.
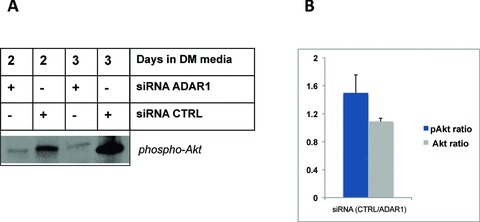
ADAR1 knockdown impairs phospho‐Akt levels in cytokine‐stimulated differentiating muscle cells. (A) C2C12 MPCs were plated and, on the following day, transfected in duplicate using siRNA to ADAR1 or control (Accell siRNA control). Twenty‐four hours posttransfection, cells were stimulated with IFN‐γ to induce ADAR1 expression and cultured for 2–3 days, then harvested and pooled for total protein on day 2 and day 3, respectivley. Total Akt and phospho‐Akt (Cell Signaling) levels were probed by western blot, as indicated. (B) The p‐Akt bands and total Akt (not shown) for each transfection pair were quantifi ed using ImageJ and relative intensities were plotted on a bar graph and signifi cance evaluated using a t‐test, p= 0.079, indicating a trend difference.