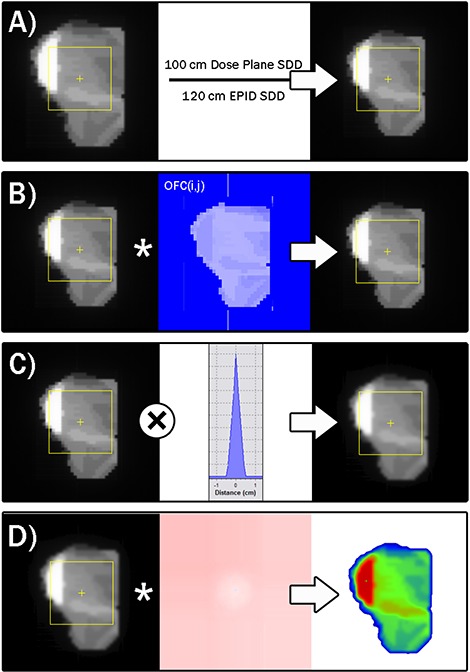
Figure 5.

Progression of conversion of a raw EPID image into an absolute dose plane. Panel A illustrates the geometric scaling from the EPID distance to the desired dose plane distance. Panel B shows the scaling of each pixel by the 2D output correction map, derived using the MLC segment data (size, shape, relative meterset weight). Panel C shows the convolution with the dose redistribution kernel to emulate dose distribution in a water phantom at the modeled QA dose plane depth. Panel D illustrates the conversion to absolute dose values using the wide field calibration map.
