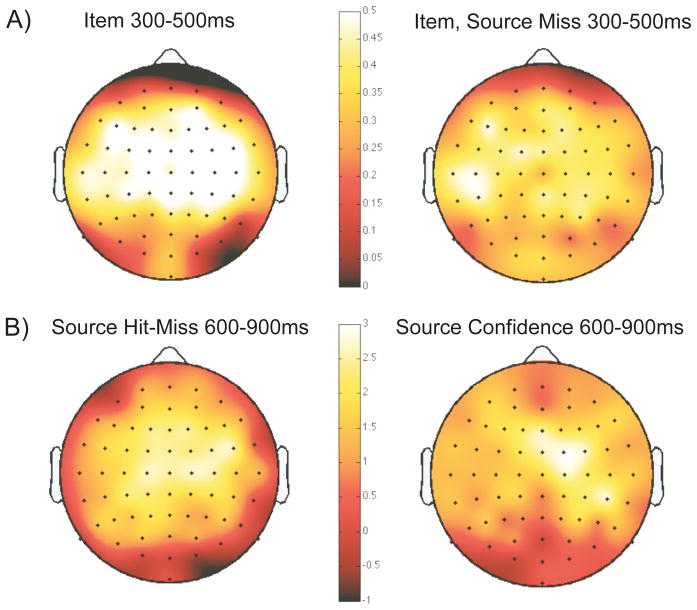
Figure 6.
Scalp topographies from both the traditional and restricted confidence analyses. A) Topographic maps created from the mean R values from a four-point linear regression of mean amplitudes from 300–500ms across confidence levels at each electrode site. Shown are these topographies for the unrestricted Item strength analysis (left) and for the Item effects restricted to source misses (right). B) Topographies of the mean difference between items remembered with and without source (left) and the difference between high and low confidence source trials restricted to HC item trials (right), from 600–900ms.

