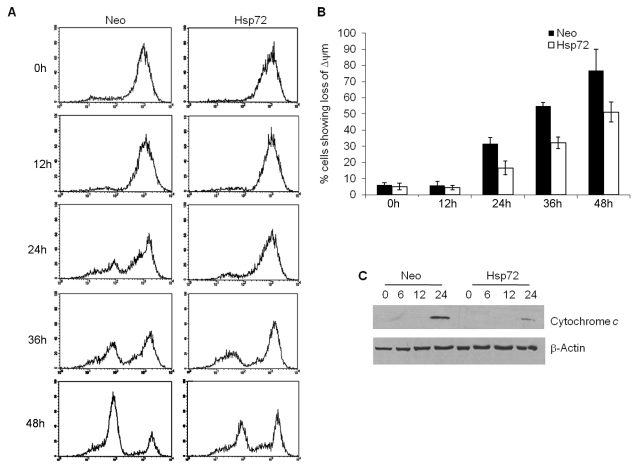
Figure 2. Hsp72 prevents ER stress-induced loss of mitochondrial membrane potential and cytochrome c release.
The control (Neo) and Hsp72 expressing (Hsp72) PC12 cells were treated with (0.25 µM) Tg for the indicated time points. (A) Mitochondrial membrane potential was assessed by TMRE staining and flow cytometry. A representative image of three independent experiments is shown. (B) Following treatment, cells were incubated with TMRE (100 nM). Mitochondrial membrane potential was monitored by measuring the fluorescence intensity at 582 nm (FL2). Average and error bars represent mean ± SD from three independent experiments. (C) Cytosolic extracts were prepared as described in Materials and Methods and resolved by SDS-PAGE followed by Western blotting using antibodies against cytochrome c and β-actin.

