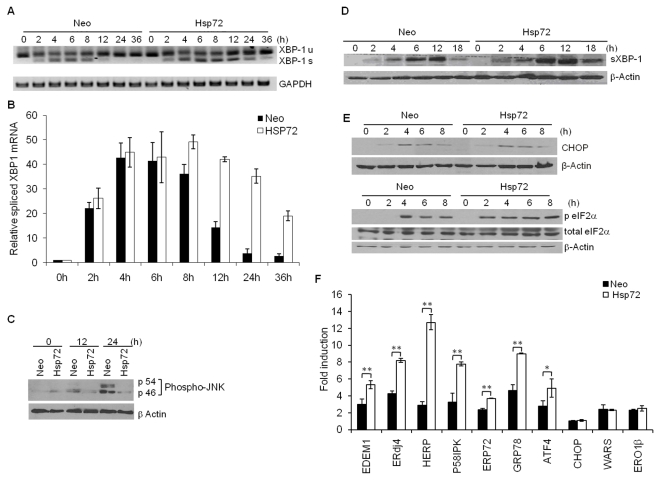
Figure 3. ER stress-induced activation of IRE1α/XBP1 axis is increased in Hsp72 expressing cells.
(A) The control (Neo) and Hsp72 expressing (Hsp72) PC12 cells were treated with (0.1 µM) Tg for indicated time points. RT-PCR analysis of total RNA was performed to simultaneously detect both spliced and unspliced XBP1 mRNA and GAPDH. Size of PCR products: unspliced XBP1 = 289 bp, spliced XBP1 = 263 bp. The image is presented inverted for greater clarity. (B) In the experiment described in (A), XBP1 mRNA splicing was calculated after densitometric analysis of the XBP1s PCR products. Average and error bars represent mean ± SD from three independent experiments. (C–E) The control (Neo) and Hsp72 expressing (Hsp72) PC12 cells were treated with (0.25 µM) Tg for the indicated time points. (C) Immunoblotting of total protein was performed using antibodies against phospho-JNK and β-actin. (D) Immunoblotting of total protein was performed using antibodies against spliced XBP1 and β-actin. (E) Immunoblotting of total protein was performed using antibodies against CHOP, phospho-eIF-2α, total eIF-2α, and β-actin. (F) The control (Neo) and Hsp72 expressing (Hsp72) PC12 cells were treated with (0.1 µM) Tg for 12 h, and the expression level of indicated genes was quantified by real-time RT-PCR, normalizing against GAPDH. Average and error bars represent mean ± SD from two independent experiments performed in triplicate. * indicates a statistical significance between Neo and Hsp72 cells; p<0.05. ** indicates a statistical significance between Neo and Hsp72 cells; p<0.005.

