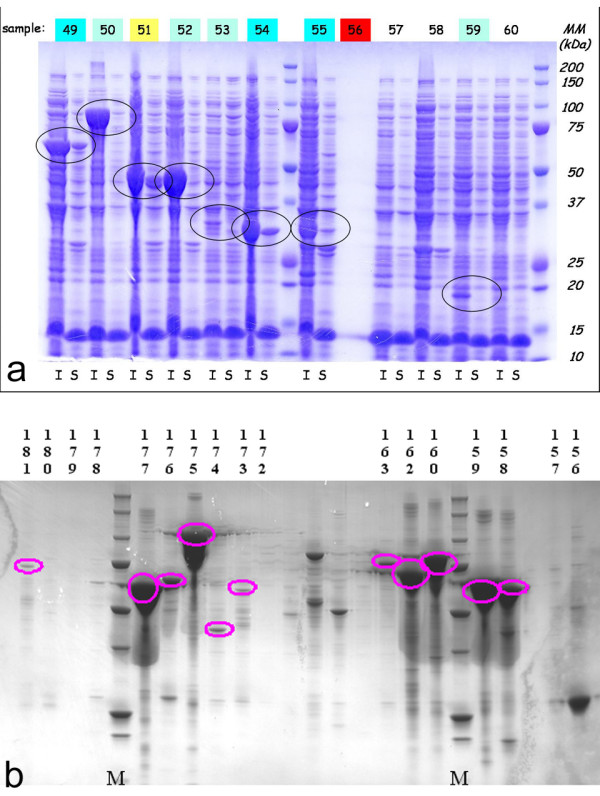
Figure 2.

Assessing soluble and insoluble protein expression levels in the medium throughput strategy. a. SDS-PAGE of Insoluble (I) and soluble (S) crude cellular extracts of the E. coli expression cultures. Targets 50 to 60 are shown. Black circles surround bands of correct size for a given target. b. Western-blot using anti-His antibody of selected targets highlighted after purification of soluble cell lysis extracts on mini-affinity (His) columns. Selected targets between 156 and 181 are shown. Pink circles highlight bands of correct size for a given target.
