
Figure 2.
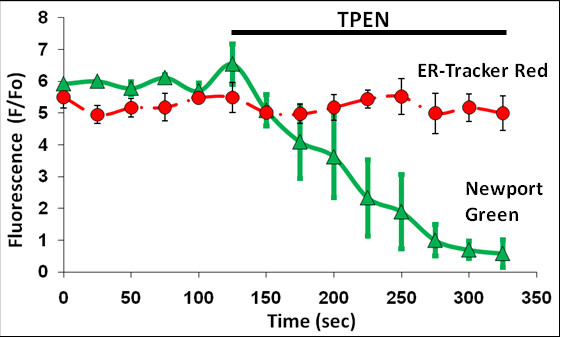
Effect of Zn2+ chelation. The graph indicates the fluorescent response of Newport Green (green line) and ER-Tracker Red (red line) in unstimulated neurons upon TPEN (10 μM) exposure, data points represent the mean ± SD of n = 5 trials. The quenching of Newport Green fluorescence with TPEN indicates the presence of free Zn2+ in the basal condition.