
Figure 4.
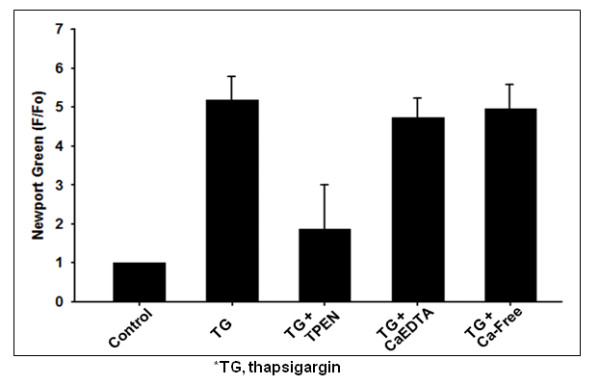
Summary of Zn2+ transients induced by thapsigargin in cortical neurons. The bar graphs show peak fluorescence after the treatment with thapsigargin alone (n = 6), thapsigargin plus TPEN (10 μM; n = 6), thapsigargin plus CaEDTA (1 mM; n = 3), and thapsigargin in the medium without added Ca2+ (n = 4). Data points represent the mean ±SD.