
Figure 5.
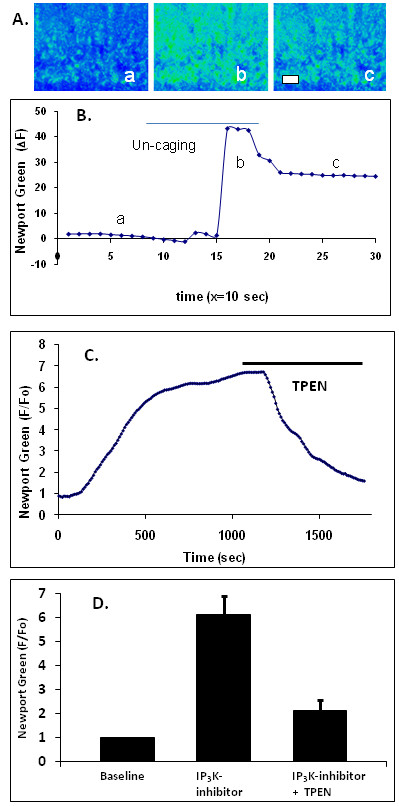
IP3 stimulation results in the release of intracellular Zn2+. A. The photo-uncaging of caged IP3 (2 μM) in brain hippocampal neurons loaded with the Zn2+ fluorescent indicator Newport Green results in an increase of cytosolic Zn2+. Scale bar = 20 μm and the images a, b, and corresponding to points in B. B. The graph shows a change of fluorescence in response to IP3 stimulation. C. A change of fluorescence in responses to the treatments of the IP3-3K inhibitor N2-(m-trifluorobenzyl),N6-(p-nitrobenzyl)purine (20 μM) and TPEN (10 μM) in cells loaded with Newport Green. D. Bar graph shows the average response of Newport Green to the IP3K-inhibitor (n = 4). The application of TPEN at the peak of fluorescence resulted in significant (n = 2) fluorescence quenching, demonstrating that the fluorescence elevation was due to increased free Zn2+.