
Figure 5.
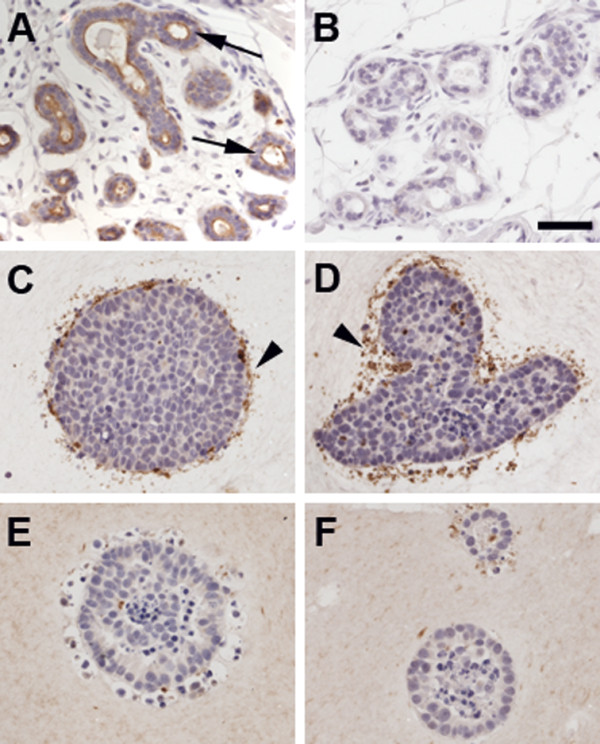
Immunohistochemical analysis of CEACAM protein expression. Panel A: representative field of normal human breast showing positive staining for CEACAM in the apical side of the epithelial cells (arrows). Panel B: human breast section used as negative control for antibody specificity. Panels C and D are representative images of MCF7 cells cultured in collagen gels either alone (C) or with RMF (D). Panels E and F represent MCF7 cells cultured in mixed gels either alone (E) or with RMF (F). CEACAM staining was negative in MCF7 cells, regardless of the culture conditions. Arrowheads depict unspecific staining. Scale bar: 50 μm