
Figure.
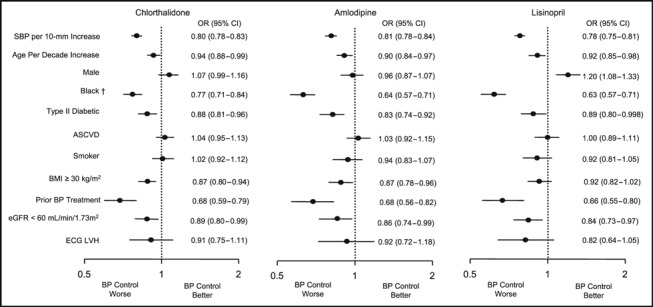
Characteristics that predicted better or worse blood pressure (BP) control (BP <140/90 mm Hg) within each drug group. Depicted are odds ratios (ORs) and their 95% confidence intervals (CIs) from 3 multiple logistic regression analyses of BP control at year 3; separate analyses were done for each randomized treatment group. An OR >1.0 indicates that the corresponding characteristic is associated with better BP control than its complementary subgroup (eg, the OR of 1.2 for men receiving lisinopril indicates 20% better BP control than among women receiving lisinopril); an OR <1.0 indicates worse BP control for the corresponding subgroup relative to its complement. The sample sizes for the respective logistic models were 11,262 (chlorthalidone), 6697 (amlodipine), and 6423 (lisinopril). †In a model combining all 3 treatment groups and including drug main effects and interaction terms (amlodipine/chlorthalidone and lisinopril/chlorthalidone ), the relative odds of BP control differed significantly by treatment group only for race (amlodipine/chlorthalidone interaction: OR, 0.911, P<.01, and lisinopril/chlorthalidone interaction: OR, 0.895, P<.001). SBP indicates systolic blood pressure; ASCVD, atherosclerotic cardiovascular disease; BMI, body mass index; eGFR, estimated glomerular filtration rate; ECG LVH, left ventricular hypertrophy on electrocardiography.