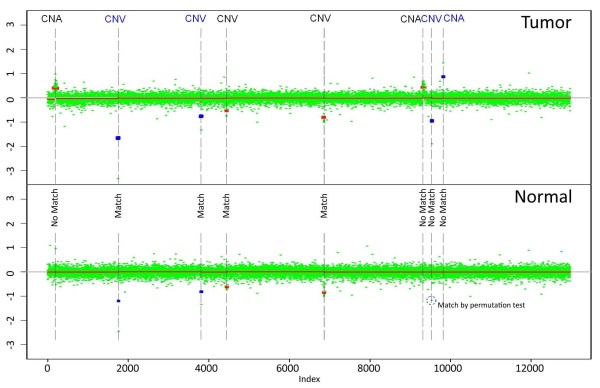
Figure 1.
Example of CNVs and CNAs. One chromosome is shown. Segments in blue are found only in unsmoothed data. The upper panel contains tumor, while the lower panel is a matching normal sample. CNVs have either a matching segment in the normal sample identified by a segmentation algorithm or matching significantly extreme log-ratios identified by a permutation test. Regions of the normal sample corresponding to CNAs are normal.

