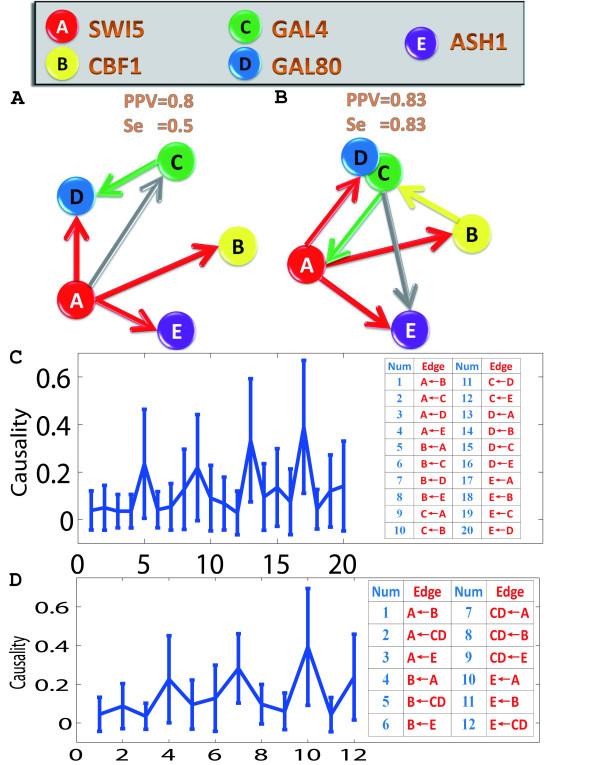
Figure 3.
Conditional Granger causality approach applied on experimental gene data. The experiment measured the expression level of 5 genes after a shift from galactose-raffinose- to glucose-containing medium. The regulatory network was inferred by using conditional Granger causality approach. Solid gray lines represent inferred interactions that are not present in the real network, or that have the wrong direction (FP false positive). PPV [Positive Predictive Value = TP/(TP+FP)] and Se [Sensitivity = TP/(TP+FN)] values show the performance of the algorithm for an unsigned directed graph. TP, true positive; FN, false negative. (A) The network structure of 5 genes derived by conditional Granger causality. (B) Gal4 and Gal80 were grouped as a single node, so that only transcriptional regulation interactions are represented. (C) Conditional Granger causality results for 5 genes. The 95% confidence intervals graph, which is constructed by using bootstrapping method, is plotted. (D) Conditional Granger causality results for a grouped genes (Gal4 and Gal80 are grouped). The 95% confidence intervals graph, which is constructed by using bootstrapping method, is plotted.

