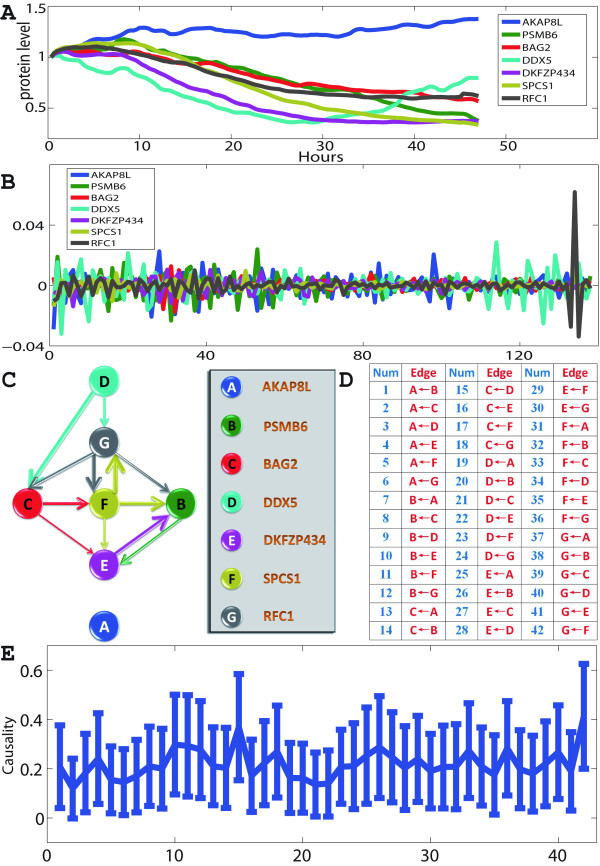
Figure 4.
Conditional Granger causality approach applied on experimental protein data. The experiment measured the levels of 7 endogenously tagged proteins in individual living cells in response to a drug. (A) The time traces of 7 proteins are plotted. There are 141 time points. The time interval is 20 minutes. (B) ARIMA model is used to fit the data. We applied term-by-term differencing 3 times to the data. (C) The network structure for 7 proteins derived by using conditional Granger causality approach. (D) For visualization purpose, all directed edges (causalities) are sorted and enumerated into the table. (E) Conditional Granger causality results. The 95% confidence intervals graph, which is constructed by using method bootstrap, is plotted.

