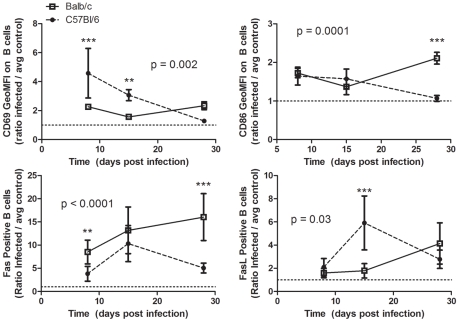
Figure 6. Expression of CD69, CD86, Fas, and FasL on splenic B cells.
Splenocytes were harvested and stained for analysis by flow cytometry at multiple time-points post-infection with T. cruzi in Balb/c and C57BL/6 mice. Balb/c are represented by open squares, solid line; C57Bl/6 mice by closed circles, dashed line. ** p<0.01, *** p<0.001 by Bonferroni post-test after 2-Way ANOVA comparing Balb/c and C57Bl/6 models (p values reported on graphs) and/or Student's t test.

