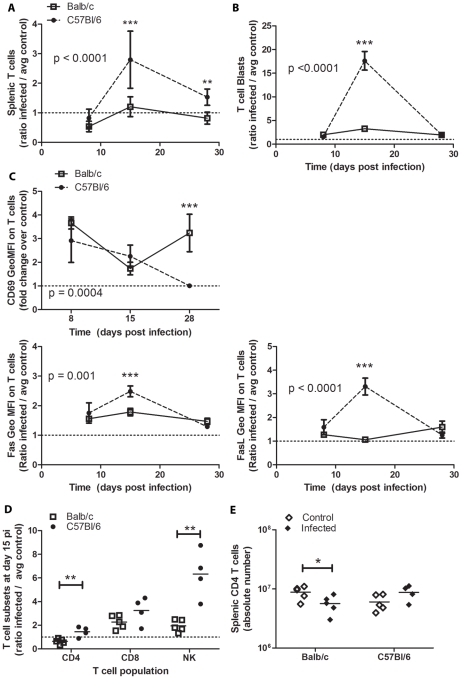
Figure 8. T cell expansion and activation in the spleen.
Splenoctyes were harvested from Infected and control mice at days 8, 15, or 28 post-infection and analyzed by surface markers for T cell populations. Populations are reported as the ratio of absolute cell numbers or geometric mean florescent intensity (GeoMFI) on T cells in infected mice to the average absolute numbers for control mice. Data represent four-five infected mice per time-point. Balb/c are represented by open squares, solid line; C57Bl/6 mice by closed circles, dashed line. * p<0.05, ** p<0.01, *** p<0.001 by Bonferroni post-test after 2-Way ANOVA comparing Balb/c and C57Bl/6 models (p values reported on graphs) and/or Student's t test.

