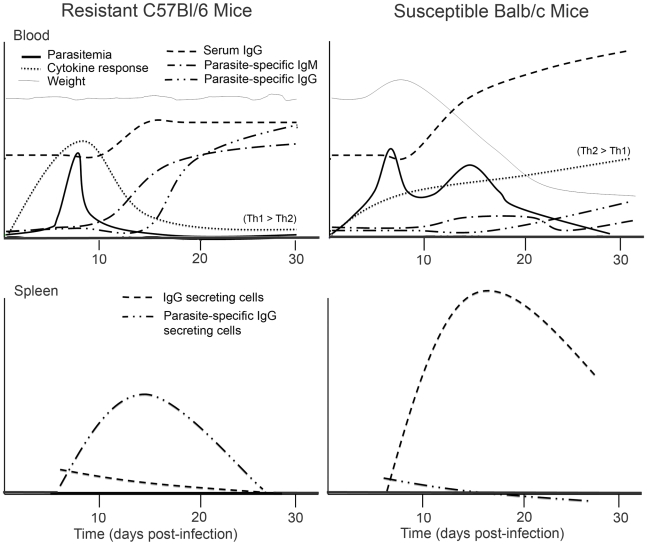
Figure 9. Differential antibody and cytokine responses associated with resistance to T. cruzi.
These plots model responses in T. cruzi infected C57Bl/6 and Balb/c mice compared to control mice inoculated with heat-inactivated parasite (original data in Fig 1– 5) and show the association of parasite-specific antibody responses in the blood and spleen with decreased polyclonal antibody responses and differential cytokine expression (kinetics and quality summarized here). Serum cytokine levels (see Fig 3 for details) in C57Bl/6 compared to controls were IFN-γ>TNF-α = IL-6>IL-10 with significantly elevated IL-12p40 and undetectable IL-5. The overall cytokine profile of Balb/c mice was IL-10≥IL-5, IL-6, and TNF-α, with increased IFN-γ and IL-12p40 later during infection (Fig. 3). The isotype of serum IgGs for C57Bl/6 mice were IgG1>IgG3>IgG2b>IgG2c, whereas Balb/c mice were IgG1>IgG2a>IgG3>IgG2b (Fig 4). Weight; the y-intercept is 100% and the origin is approximately 80% of the baseline. Parasitemia; the origin is the limit of detection (104 parasites/mL) and peak parasitemia approximately 5×10⁵ parasites/mL. For cytokine responses, serum IgG, and parasite-specific IgM/G in both the blood and the spleen, the y-axis is the relative change in infected versus control mice and is to scale for each measure (i.e. directly compare IgG between C57Bl/6 and Balb/c mice). The plots for serum IgG are offset above the others for clarity.

