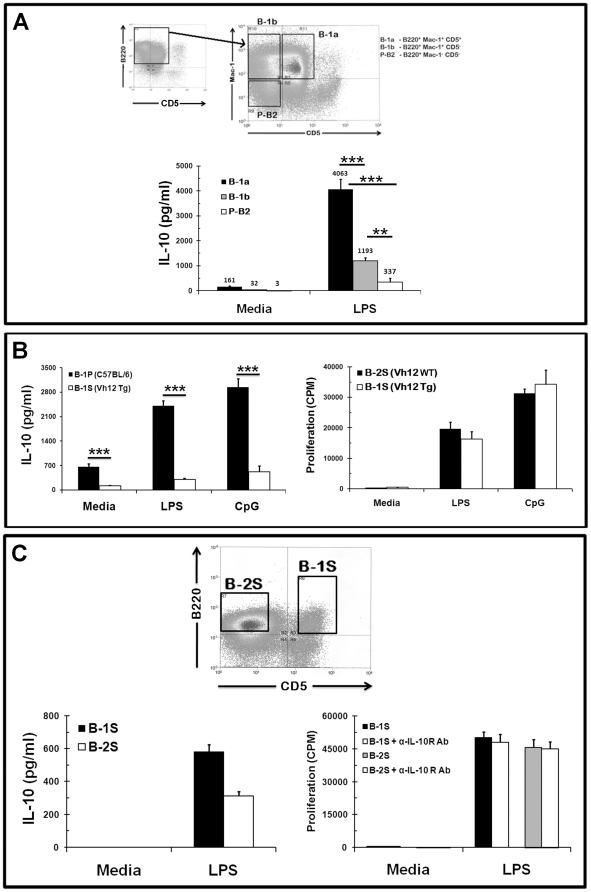
Figure 3. B-1a cells are the major IL-10 producing cells among peritoneal and splenic B cell populations.
(A) Macrophage depleted peritoneal cell populations were gated on B220+ cells and further separated into B-1a (Mac1+CD5+), B-1b (Mac1+CD5−) and B-2 (Mac1−CD5−) using a FACS machine (top panel). Sorted B-1a, B-1b and B-2 cells were cultured with LPS for 48 hours. The culture supernatants were collected and assayed for IL-10 (bottom panel). Data are shown as mean ± SD of triplicate cultures and are representative of two independent experiments with 15 mice each. The p-values signify the differences in IL-10 production by B-1a cells in comparison to B-1b and B-2P cells (*** = p<0.0005) and between B-1b and B-2P cells (** = p<0.005). (B) B-1P cells from C57BL/6 and B-1S cell from VH12 Tg mice were cultured with LPS or CpG for 48 hours; culture supernatants were collected at 48 hours and assayed for IL-10 (left panel). B-2S cells from VH12 wild type littermate (WT) mice and B-1S cell from VH12 Tg mice were cultured with LPS or CpG for 48 hours and cell proliferation was assessed by 3[H] thymidine incorporation (right panel). Similar results were obtained in two other experiments (mean ± SD with five mice per group). The p-value (*** = p<0.0005) signify the differences in response between B-1P and B-1S cells. (C) Total spleen cells from C57BL/6 mice were sorted into B-2S (B220+CD5−) and B-1S (B220+CD5+) cells on the basis of CD5 expression. Sorted B-2S and B-1S cells were cultured with LPS for 48 hours, culture supernatants were collected and assayed for IL-10 (bottom left panel), and for proliferation (bottom right panel) with or without anti-IL-10R antibody. Representative results from the one of two experiments are shown (mean ± SD, n = 5).

