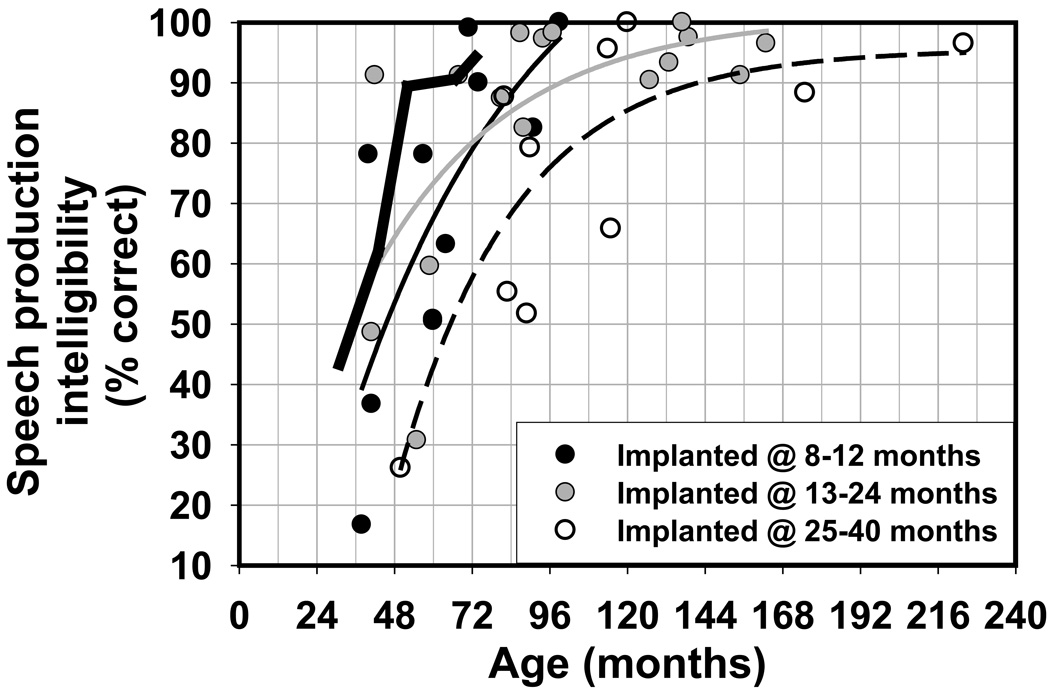
Figure 2.
Speech production intelligibility as a function of age at testing for the individuals in three age-at-implant groups: black circles for children implanted at 8–12 months, gray circles for those implanted at 13–24 months, and unfilled circles for those implanted at 25–40 months. Black, gray, and dashed thin lines, respectively, represent the results of the nonlinear regression used to fit the data for the three groups. The thick black line represents average data obtained from normal-hearing children.

