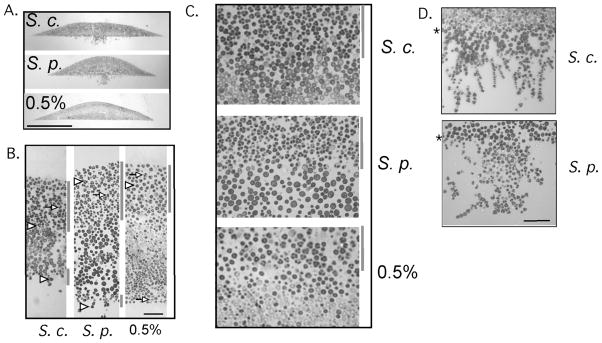
Fig. 5. Pattern of sporulation in wild isolates of S. cerevisiae and S. paradoxus.
Colonies of wild S. cerevisiae (S. c.) and S. paradoxus (S. p.) were grown on YNA medium for six days, or colonies of wild S. cerevisiae were grown on 0.5% synthetic glucose medium (0.5%) for 8 days, then embedded and sectioned as in Fig. 1. Arrowheads indicate representative tetrad asci (three or four spores visible), whereas arrows indicate representative dyad asci (two spores). A) Section through center of entire colony, scale bar = 0.5 mm, B) Vertical slice of section, from top to bottom of colony, scale bar = 30 μm. C) Portion of colony containing boundary between high sporulating region at top and low sporulating region. D) Portion of colonies grown on YNA medium that invades the agar. Asterisks to left of images indicate the agar surface, scale bar = 30 um. Gray bars to right of images in (B) and (C) indicate regions containing a high frequency of asci. For the images in B–D, at least three independent colonies from each of two wild S. cerevisiae and two S. paradoxus strains were examined and yielded similar patterns.

