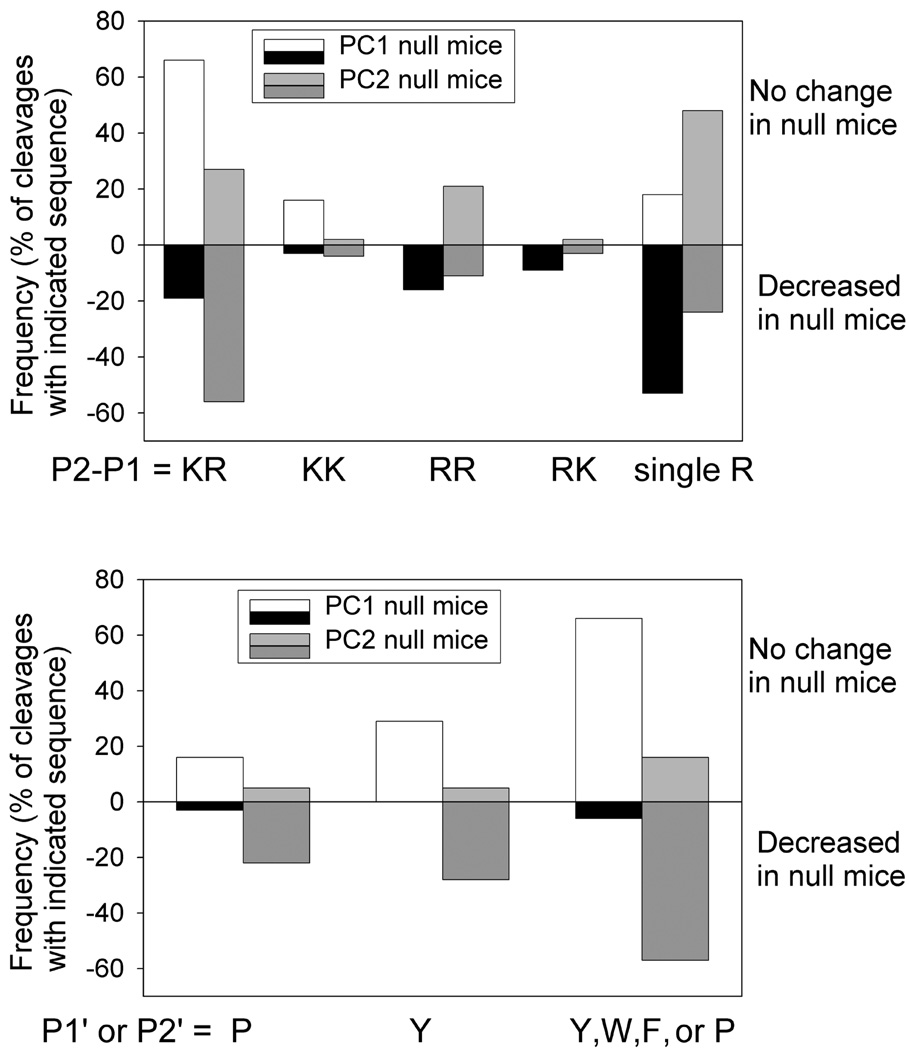
Figure 2.
Cleavage site analysis for PC1/3 null and PC2 null mice. Graphs show frequency at which peptides are cleaved at specific residues in peptides that either decrease or show no change in PC1/3 null or PC2 null mice relative to wild-type mice. Graph A indicates these frequencies in P2 and P1 positions. “Single R” refers to cleavages with a non-basic residue in the P2 position, but does not take into account if there is a basic residue in the P4 or P6 positions. Graph B indicates frequencies of selected residues in the P1’ and P2’ positions. The individual peptides used for this analysis are listed in Table 1, and the numbers of peptides in each category are indicated in Table S2, supplement.

