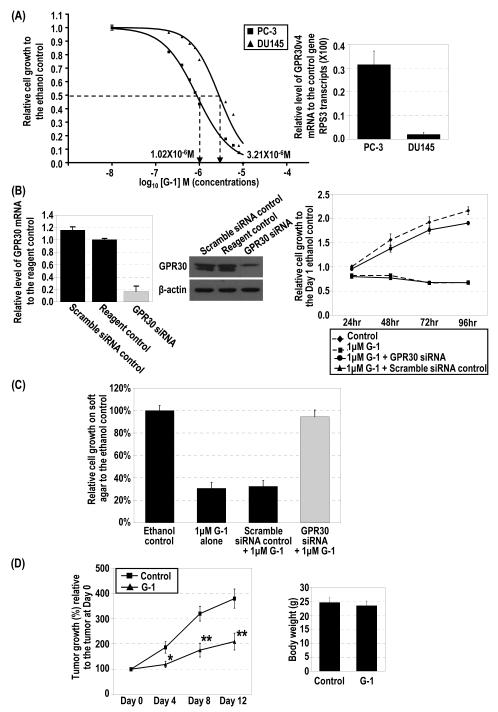
Figure 1.
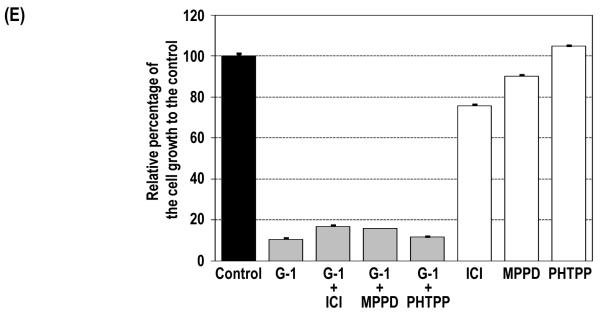
G-1–induced inhibition of cell growth via G2/M arrest and relative expression of GPR30 mRNA in PCa cells. (A) PC-3 (■) and DU145 (▲) cells were treated with 10−8–10−5 M G-1 for 4 days, and control cells were treated with ethanol. Cell growth relative to that of the control at day 4 was plotted against the concentrations of G-1 with sigmoid curve fitting, and the IC50 was determined. Levels of expression of GPR30 mRNA in PC-3 and DU145 cells were quantified by real-time RT-PCR analysis. (B) siRNA specifically reduced GPR30 expression as determined by real-time RT-PCR analysis and Western blot analysis. PC-3 cells were treated with 1 μM G-1 for 4 days in the presence of GPR30 siRNA or scramble siRNA as a control. Two reagent controls with ethanol and with G-1 were included. The growth of the cells relative to that of the ethanol control at day 1 was determined. (C) G-1 inhibited anchorage-independent growth via GPR30-mediated signaling. Relative cell growth on soft agar to the ethanol-treated control cells for G-1–treated PC-3 cells with either GPR30 siRNA or scramble control siRNA are presented. (D) G-1 inhibited tumor growth of PC-3 xenografts in vivo. The percentage of tumor growth relative to the original size of the tumors at day 0 in the G-1–treated mice (▲) and control mice (■) and the body weights of mice after removal of xenografts are presented. *, p<0.05; **, p<0.005. (E). PC-3 cells were treated with 1 μM G-1 for 4 days in the presence of 1 μM ER antagonists (ICI 182,780 [ICI], MPP dihydrochloride [MPPD] and PHTPP. Cell growth relative to that of the ethanol control at day 4 is presented. The cell growth for the ethanol control was set as 1. Column, mean; bar, standard deviation.


