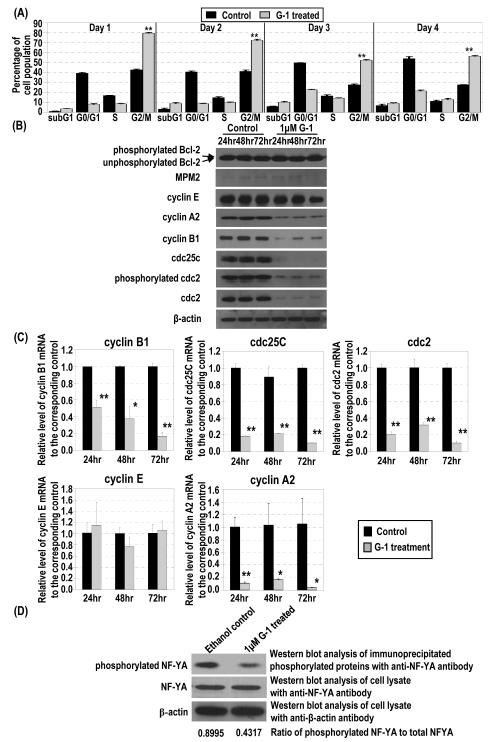
Figure 2.
Effects of G-1 on expression of cell-cycle regulators and markers and NF-YA phosphorylation. (A) Percentages of PC-3 cells treated or not treated with 1 μM G-1 at different cell-cycle phases were determined by flow cytometry. (B) The lysates of PC-3 cells treated with 1 μM G-1 or ethanol were subjected to Western blot analysis to determine the protein level of phosphorylated bcl-2, MPM2, cyclin E, cyclin A2, cyclin B1, cdc25C, phosphorylated cdc2, total cdc2, and β-actin. (C) Cells were subjected to real-time RT-PCR analysis to determine mRNA levels. *, p<0.01; **, p<0.001. (D) The cell lysates were immunoprecipitated with antibody to phosphoserine/threonine/tyrosine residues. Levels of NF-YA protein in the immunoprecipitates were determined by Western blot analysis. The levels of β-actin protein were used as loading control for immunoprecipitation. Ratio of phosphorylated NF-YA to total NF-YA for ethanol and G-1 treated cells are presented.

