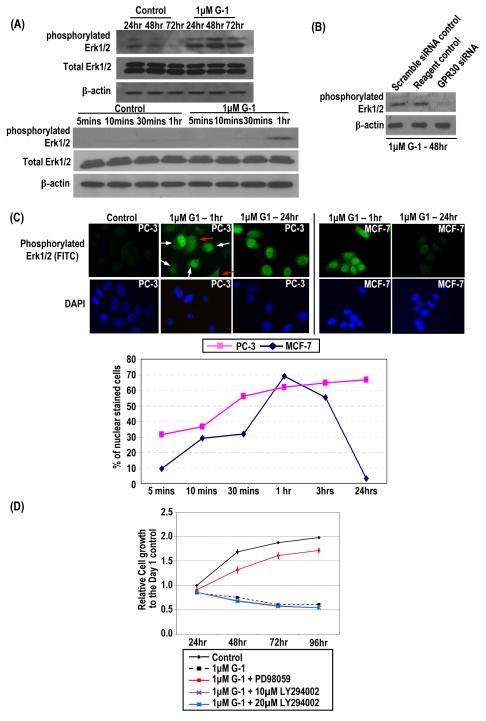
Figure 3.
G-1 induced rapid and sustained Erk1/2 phosphorylation with nuclear accumulation of phosphorylated Erk1/2. (A) PC-3 cells treated with 1 μM G-1 or ethanol for 3 days. Cells were lysed at early (5 min–1 h) and late (24–72 h) time points, and levels of total and phosphorylated Erk1/2 and β-actin protein were determined by Western blot analysis. (B) siRNA-treated PC-3 cells (GPR30 siRNA) and controls (scramble siRNA control and reagent control), all treated with 1 μM G-1, were lysed, and levels of phosphorylated Erk1/2 and β-actin protein were determined by Western blot analysis. (C) PC-3 and MCF-7 cells treated with 1 μM G-1 from 5 min to 24 h. Antibody to phosphorylated Erk1/2 was used for immunofluorescence staining (green). The nuclei were stained with DAPI (blue). Representative micrographs of the 1 h– and 24 h–treated PC-3 and MCF7 cells and ethanol-treated PC-3 cells are shown. White arrows indicate cells with nuclear accumulation of phosphorylated Erk1/2; red arrows indicate cells with diffuse cytoplasmic staining. Cells with and without nuclear staining were counted, and the percentage of nuclear-stained cells from 5 min to 24 h were determined. (D) The growth of the cells treated with PD98059/LY294002 and G-1 relative to that of the ethanol control at day 1 was determined. The G-1-treated cells without pretreatment with PD98059/LY294002 and the ethanol-treated cells were used as controls.

