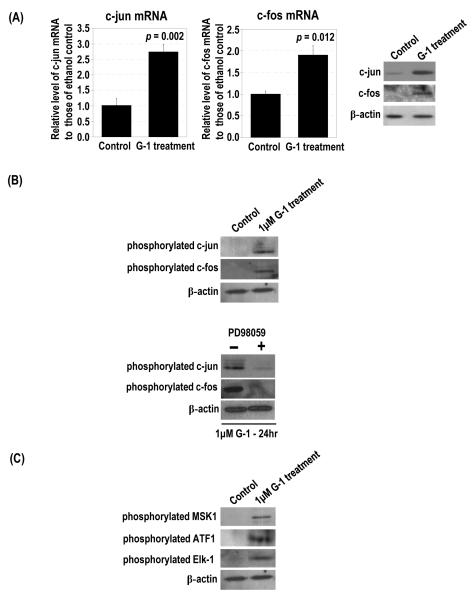
Figure 5.
G-1 upregulated c-jun and c-fos expression and phosphorylation and activated upstream regulators of c-jun. PC-3 cells were treated with 1 μM G-1. (A) The levels of c-jun and c-fos mRNA and protein in G-1–treated cells and ethanol-treated controls were determined by real-time RT-PCR and Western blot analyses, respectively. The levels of β-actin protein were used as the loading control. (B) PC-3 cells were treated with 1 μM G-1 in the presence and absence of 30 μM PD98059. The ethanol-treated cells were used as the control. The levels of phosphorylated c-jun and phosphorylated c-fos proteins in the cells were determined by Western blot analysis. (C) The levels of phosphorylated MSK1, ATF1, and Elk-1 in G-1– and ethanol-treated cells were determined by Western blot analysis.

