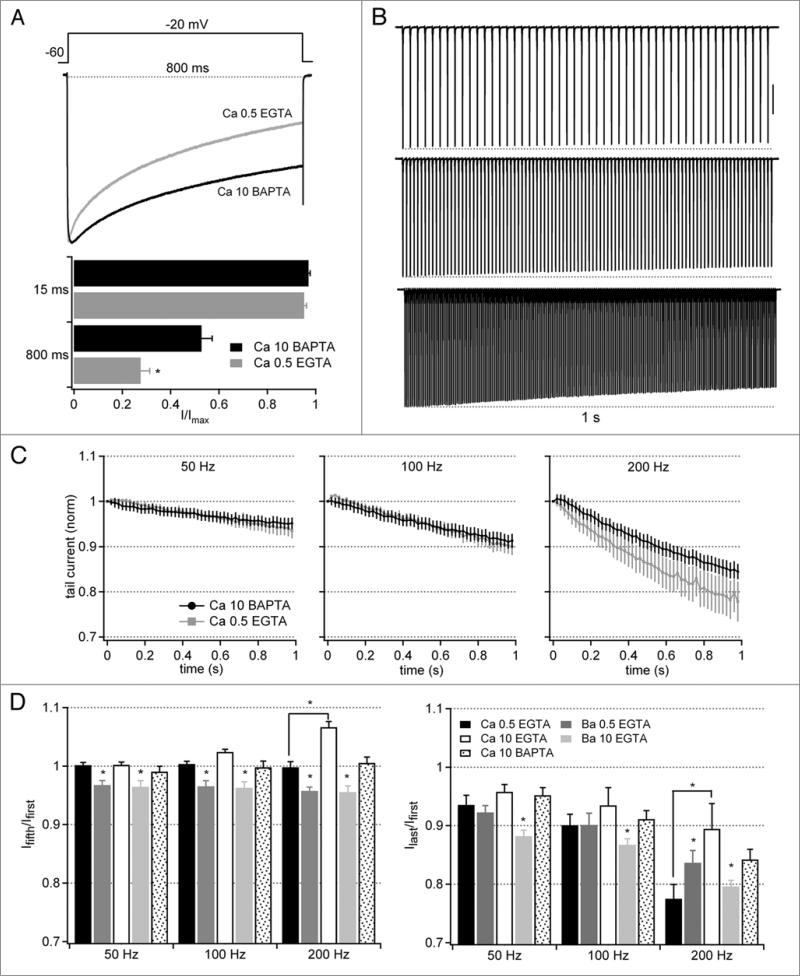
Figure 4.
Facilitation and inactivation of tail currents evoked by stimulus trains with 10 mM intracellular BAPTA. (a–C) Ca currents as in Figure 2, but with 10 mM intracellular BAPTA (n = 6). In (A), Ca current data obtained with 0.5 mM EGTA from Figure 2 are included for comparison. Vertical scale bar in (B), 1 nA. (D) Summary plots of the different buffering conditions and charge carriers. Facilitation is expressed as the ratio of the fifth to the first tail current; inactivation is expressed as the ratio of the last to the first tail current. Asterisks over bars representing Ba currents indicate statistical differences between Ba and Ca with the same buffering condition (same cells), and over bars representing Ca currents indicate statistical differences between Ca with different buffering conditions (different cells).

